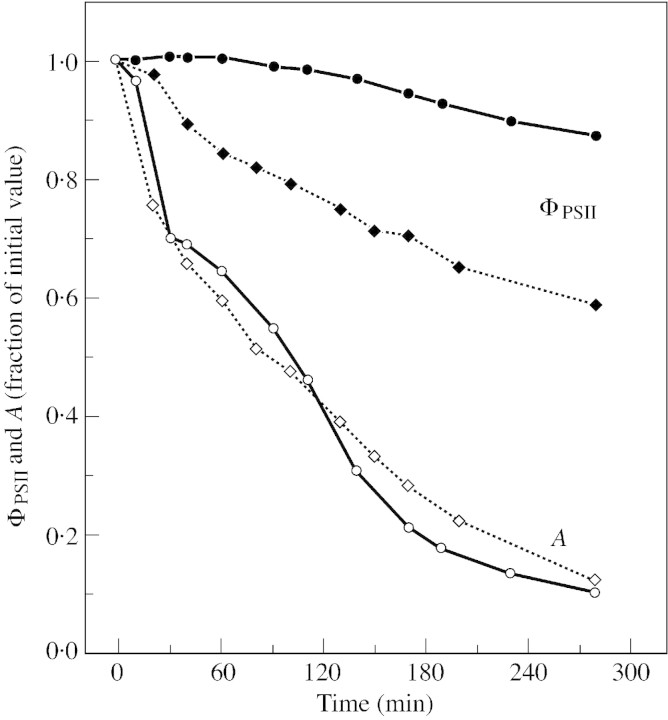
Fig. 6. Variation in relative values of ΦPSII and A during desiccation of cut leaves of L. trimestris. Chlorophyll fluorescence emission was done in parallel with net CO2 uptake during the experiments (see Figs 4 and 5). Closed symbols, ΦPSII measurements; open symbols, A measurements. Light conditions 450 (circles) or 990 (squares) µmol m–2 s–1. These measurements were performed simultaneously with the measurements presented in Fig. 4A and B.

An official website of the United States government
Here's how you know
Official websites use .gov
A
.gov website belongs to an official
government organization in the United States.
Secure .gov websites use HTTPS
A lock (
) or https:// means you've safely
connected to the .gov website. Share sensitive
information only on official, secure websites.
