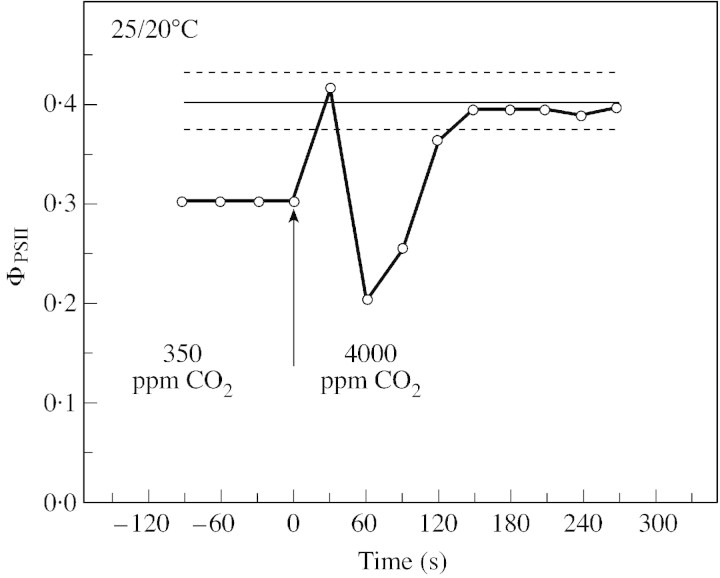
Fig. 8. Typical variation over time of ΦPSII when Ca was changed abruptly from 350 to 4000 ppm around dehydrated leaves of P. sativum plants grown at normal temperature (relative water content of the leaf = 68·2 %). Other experimental conditions were as in Fig. 7. The line parallel to the x‐axis is the mean ΦPSII value measured on well‐hydrated leaves ± s.e. (dotted lines, n = 4).

An official website of the United States government
Here's how you know
Official websites use .gov
A
.gov website belongs to an official
government organization in the United States.
Secure .gov websites use HTTPS
A lock (
) or https:// means you've safely
connected to the .gov website. Share sensitive
information only on official, secure websites.
