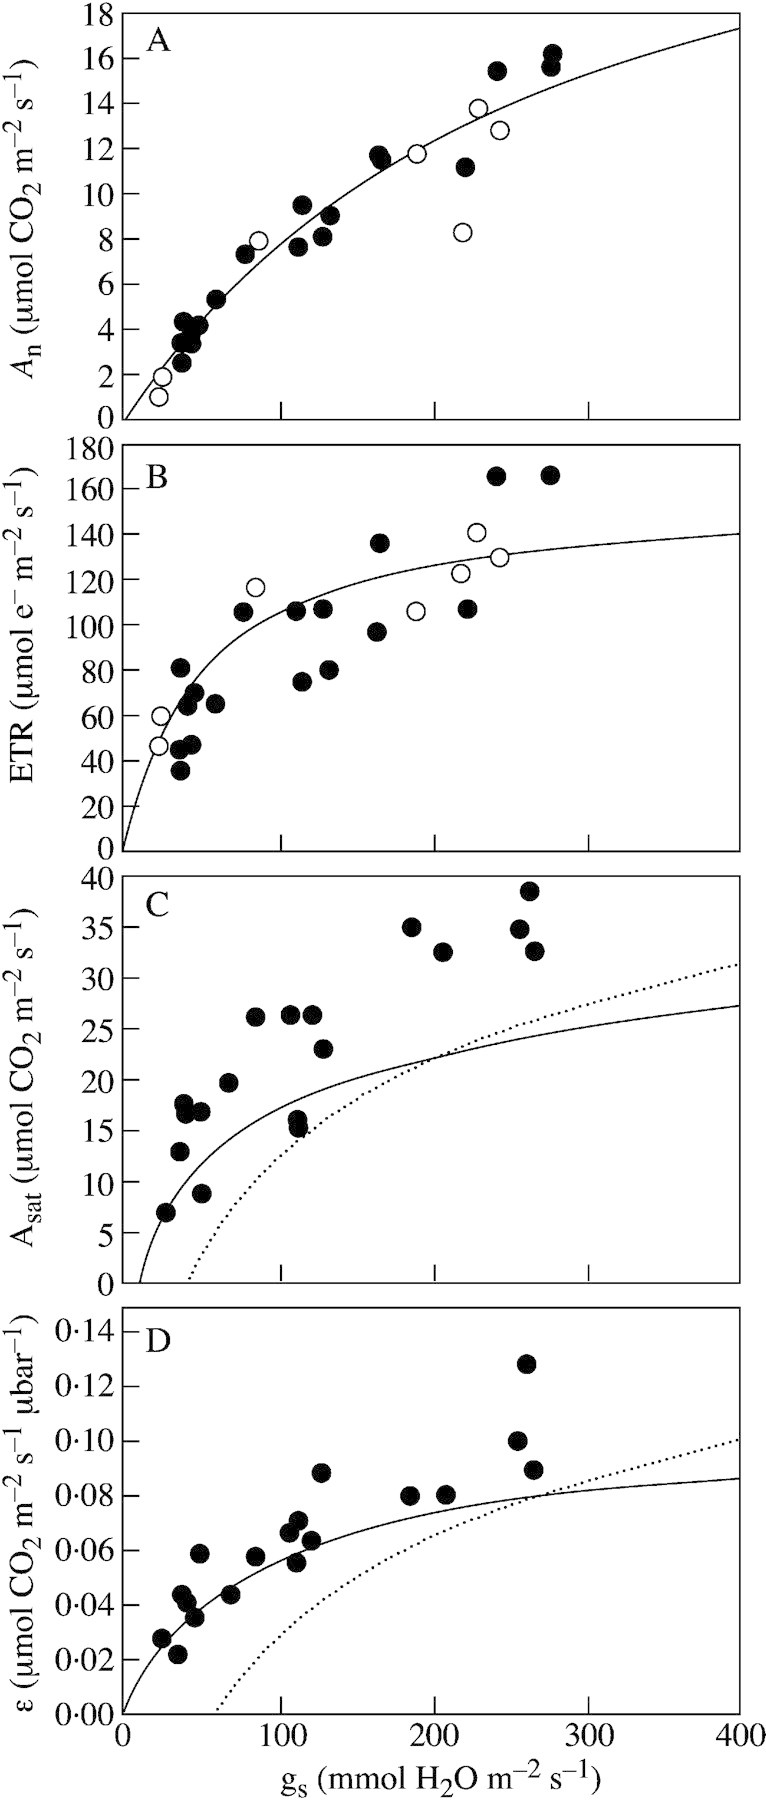
Fig. 4. This is the same as Fig. 2, after adding some data from the literature on other species to achieve a broad range of species and plant types. In all plots (A–D), data from Gulías et al. (2002) on six different Mediterranean sclerophyllous shrubs (filled circles) have been added. In A and B, data from other authors and species have been added (open circles). These include data on three different tropical understorey plants (from Ishida et al., 1999), on the evergreen sclerophyllous shrub, Pistacia lentiscus (from Flexas et al., 2001), and on alfalfa (Medicago sativa) plants (Antolín and Sánchez‐Díaz, 1993). In C and D, curves of best fit (dotted lines) between the plotted parameters obtained by Martin and Ruiz‐Torres (1992) in wheat (Triticum aestivum) are shown.
