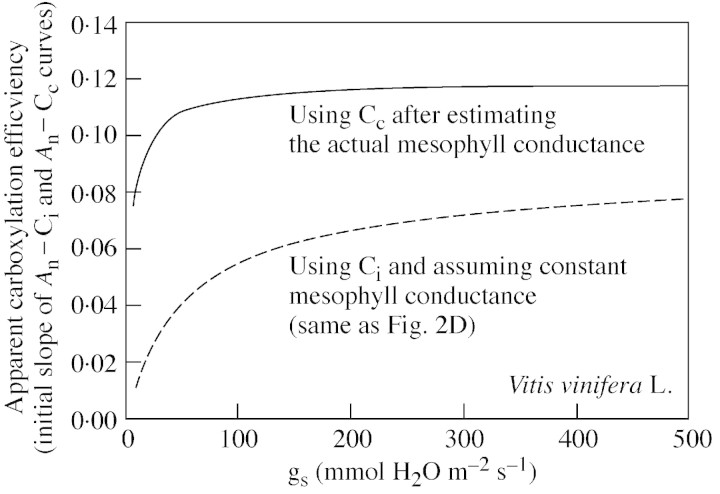
Fig. 6. Effect of changing mesophyll conductance in the calculation of the apparent carboxylation (ϵ). The graph shows ϵ as a function of stomatal conductance in field‐grown, drought‐stressed grapevines, calculated directly from An–Ci curves (broken line) or after calculating Cc, from An–Cc curves (solid line). Data are from Flexas et al., 2002a).

An official website of the United States government
Here's how you know
Official websites use .gov
A
.gov website belongs to an official
government organization in the United States.
Secure .gov websites use HTTPS
A lock (
) or https:// means you've safely
connected to the .gov website. Share sensitive
information only on official, secure websites.
