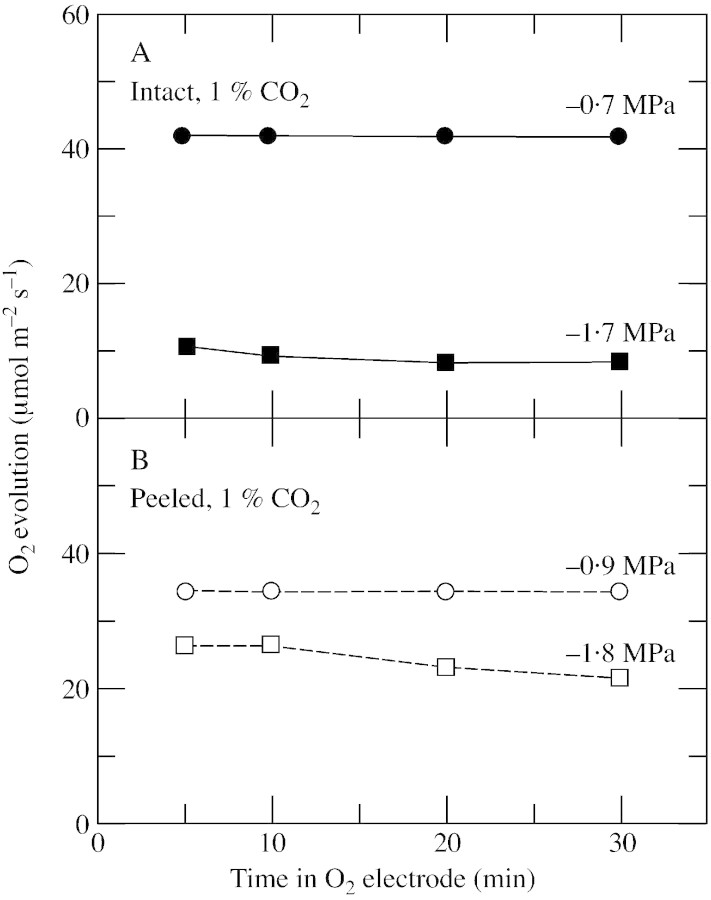
Fig. 3. O2 evolution at different times in the O2 electrode in individual leaf discs of sunflower. A, Intact discs. B, Peeled discs lacking the abaxial epidermis. Four discs were sampled from one leaf on plants with either a high or low Ψw. Two were used for measuring O2 evolution or Ψw. The other two were used for the same measurements after peeling the epidermis. The initial Ψw is shown alongside each curve. This experiment was done twice with six different CO2 concentrations ranging from 0·4 to 20 % in each experiment. All concentrations gave similar results and a representative experiment is shown only for 1 % CO2. O2 evolution was measured at an irradiance of 1200 µmol m–2 s–1 at 25 °C in saturated air containing 21 % O2.

An official website of the United States government
Here's how you know
Official websites use .gov
A
.gov website belongs to an official
government organization in the United States.
Secure .gov websites use HTTPS
A lock (
) or https:// means you've safely
connected to the .gov website. Share sensitive
information only on official, secure websites.
