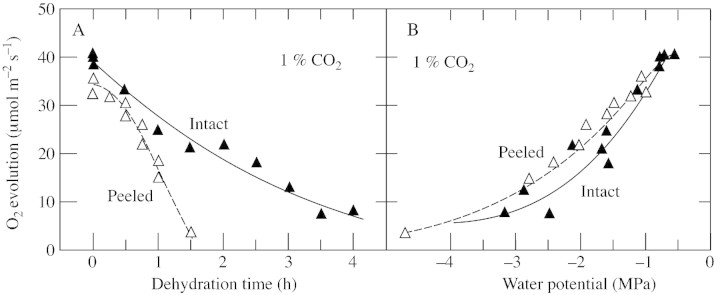
Fig. 7. O2 evolution in sunflower leaf discs sampled at high Ψw and dehydrated afterwards in the O2 electrode. A, O2 evolution at various times in 1 % CO2 (intact, closed triangles; peeled before dehydration, open triangles). B, O2 evolution at various leaf Ψw in 1 % CO2 (intact, closed triangles; peeled before dehydration, open triangles). Each data point for O2 evolution is from a separate disc, and Ψw was measured in the same disc immediately afterwards. Individual data were pooled from three repeated experiments, and the discs were sampled from two adjacent leaves from each plant. During dehydration in the electrode, irradiance was 800 µmol m–2 s–1 in air with 0·035 % CO2 at 25 °C and relative humidity of 60 %. During the O2 evolution measurements, conditions were as described in Fig. 5.
