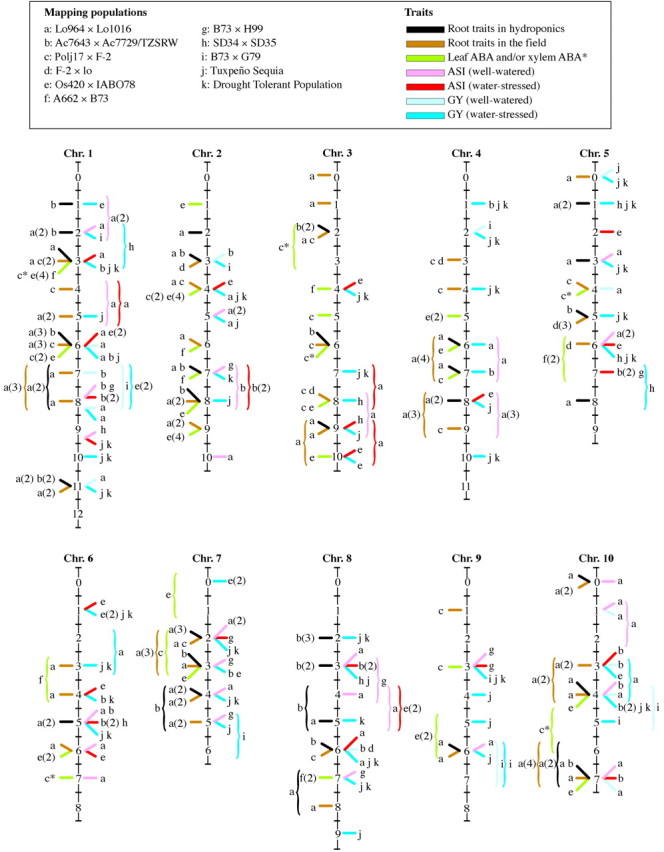
Fig. 2. Bin allocation on the maize map of the QTLs for root traits in hydroponics and in the field, ABA concentration in the leaf and in the xylem sap, anthesis–silking interval (ASI) and grain yield (GY) in 11 maize populations (a–k). Coloured bars indicate QTLs assigned to a single bin; within each bin, bar position does not reflect the most likely position of the QTL peak. Vertical parentheses spanning two bins indicate QTLs that could not be assigned to a single bin. According to the population considered, numbers in parentheses indicate the following: number of root characteristics for which a QTL was detected in hydroponics (populations a and b) or in the field (populations a, c and d); number of samplings and/or environments in which a QTL was detected for leaf ABA concentration (populations c, e and f); ASI populations a, b, e, g and h); and grain yield (GY; populations a, b, c, e, g, h, i, j and k). Asterisks indicate QTLs for the concentration of ABA in the xylem sap. QTLs for root traits and ABA concentration are reported to the left of each chromosome, while QTLs for ASI and GY are reported to the right of each chromosome. For the sake of simplicity, the QTLs for GY of the B73 × H99 population tested under low‐ and high‐nitrogen conditions have been indicated as obtained under water‐stressed and well‐watered conditions, respectively.
