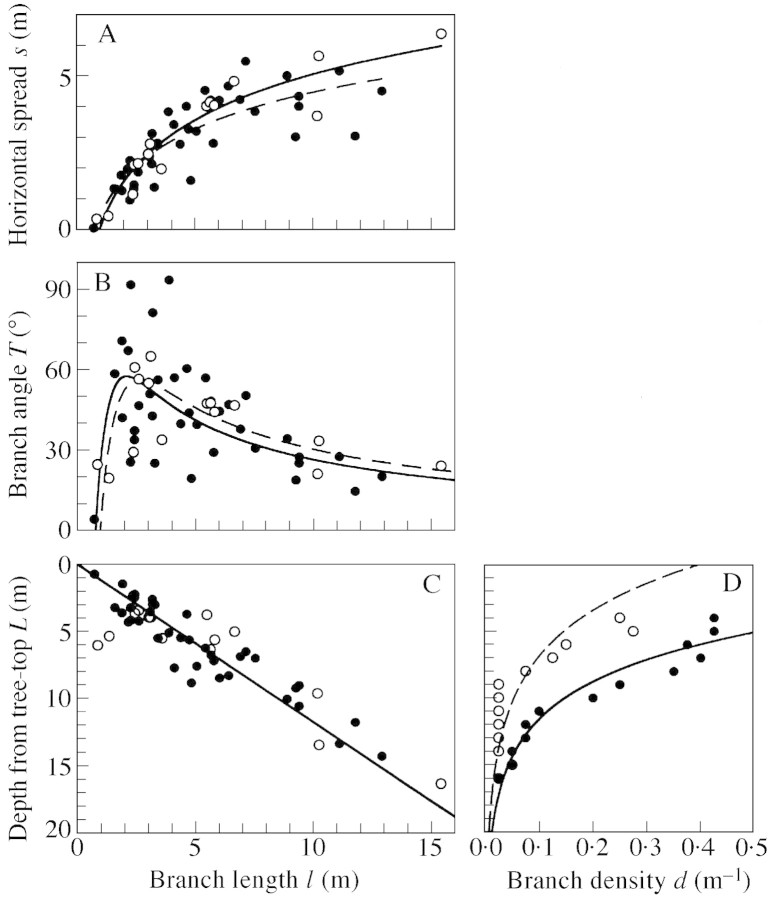
Fig. 4. General structure of the C. crenata branches. In the four figures, filled circles and solid lines show the downhill branches (n = 37), and open circles and broken lines the uphill branches (n = 15). A, Relationship between branch length (l, m) and horizontal spread (s, m), approximated by s = a ln l + b. The (a, b) values were (1·76, 0·47) for downhill branches (R2 = 0·693, d.f. = 36, F = 78·98, P < 0·01), and (2·18, 0·07) for uphill branches (R2 = 0·893, d.f. = 14, F = 108·01, P < 0·01). B, Relationship between branch length (l, m) and branch angle from vertical (T, °). Theoretically deduced curves showing T = sin –1[(a ln l + b)/l] were drawn, where (a, b) values are those obtained from the s–l relationships in A. C, Relationship between branch length (l, m) and the basal position of the branch on the trunk represented by distance from the top of the tree (L, m). Regression lines are: l = 0·856L for downhill branches (R 2 = 0·862, d.f. = 37, F = 224·16, P < 0·01) and l = 0·858L for uphill branches (R 2 = 0·772, d.f. = 15, F = 47·38, P < 0·01). D, Relationship between branch density (d, m–1) and the basal position of the branch on the trunk (L, m). The relationship was approximated by an exponential regression, ln d = –0·246L + 0·551 for the downhill branches (R2 = 0·935, d.f. = 12, F = 158·78, P < 0·01) and ln d = –0·201L –0·920 for the uphill branches (R2 = 0·666, d.f. = 12, F = 21·93, P < 0·01). The slopes were not significantly different (ANCOVA, d.f. = 22, F = 0·925, P > 0·05), but the intercepts were (ANCOVA, d.f. = 23, F = 35·53, P < 0·01). Note that in C and D the abscissa and ordinate are swapped for presentation.

An official website of the United States government
Here's how you know
Official websites use .gov
A
.gov website belongs to an official
government organization in the United States.
Secure .gov websites use HTTPS
A lock (
) or https:// means you've safely
connected to the .gov website. Share sensitive
information only on official, secure websites.
