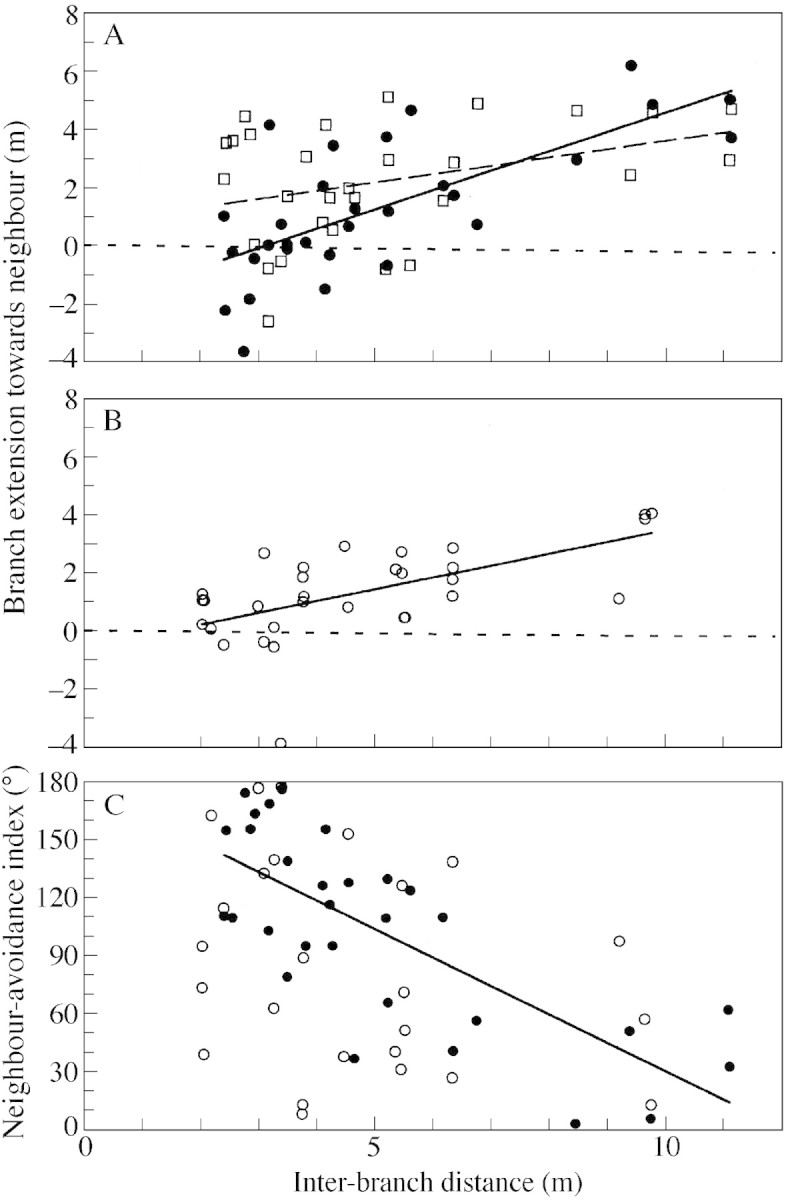
Fig. 5. Effects of inter‐branch distance on horizontal branch extension of C. crenata. In the figures, filled circles represent C‐H branches and open circles represent C‐C branches. Statistics for the regressions are given in Table 3. A, Relationship between inter‐branch distance and branch extension towards neighbour for C‐H branches (solid regression line) and H‐C branches (open squares and broken regression lines). B, Relationship between inter‐branch distance and branch extension towards neighbour for C‐C branches. C, Relationship between inter‐branch distance and neighbour‐avoidance index for C‐H and C‐C branches. The regression was not significant in the C‐C branches (Table 3).
