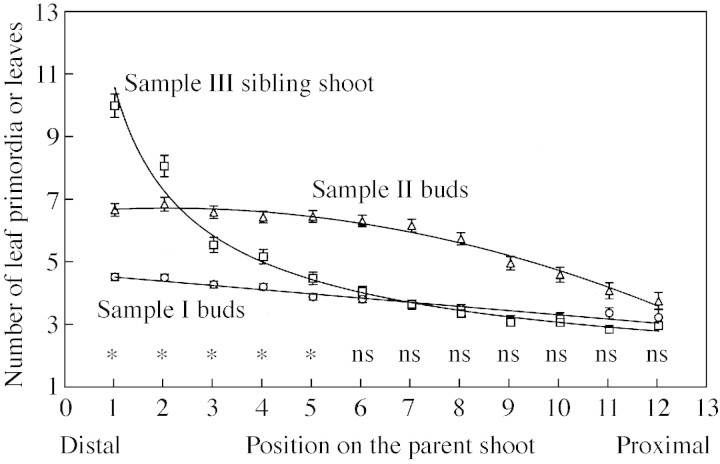
Fig. 5. Mean (± s.e.) number of leaf primordia of buds of samples I (circles) and II (triangles) and number of leaves of sibling shoots of sample III (squares). Bud and sibling shoot positions are numbered from distal to proximal nodes on the parent shoot. The significance levels of the differences between means corresponding to samples I and III are indicated: *P < 0·05 and ns P > 0·05 (Bonferroni’s adjustment was applied). The lines fitted to each data set are described in Table 2.

An official website of the United States government
Here's how you know
Official websites use .gov
A
.gov website belongs to an official
government organization in the United States.
Secure .gov websites use HTTPS
A lock (
) or https:// means you've safely
connected to the .gov website. Share sensitive
information only on official, secure websites.
