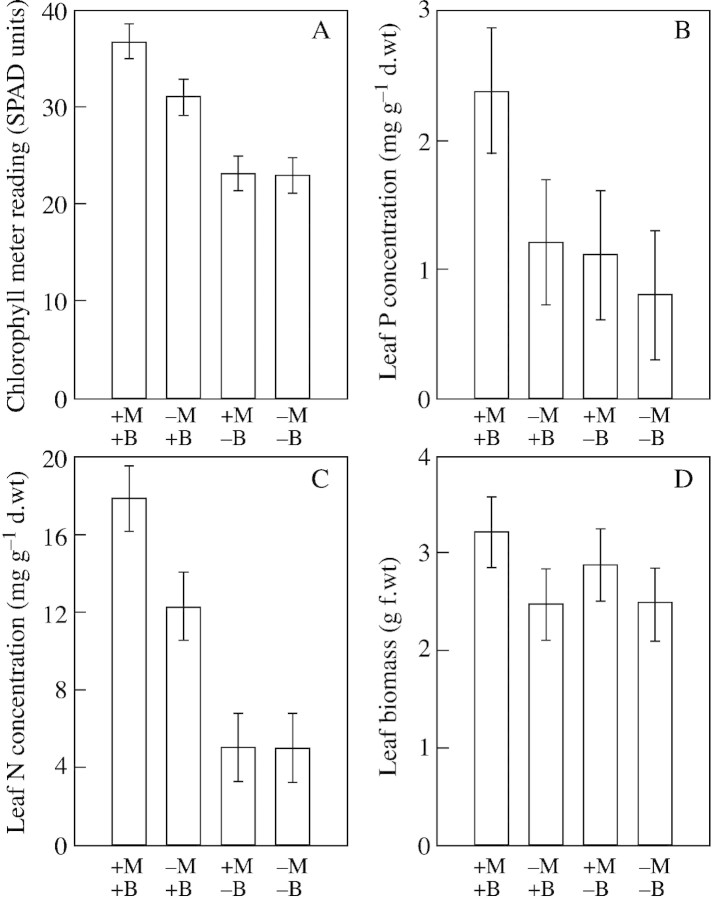
Fig. 4. Chlorophyll meter readings (SPAD units, optical density difference at two wavelengths: 650 mm and 940 mm) (A), and leaf tissue P (B) and N (C) concentrations, and leaf biomass (D) in mycorrhizal (+M) and non‐mycorrhizal (–M) willows with (+B) and without (–B) organic nutrient patch addition. Bars = 95 % LSD.

An official website of the United States government
Here's how you know
Official websites use .gov
A
.gov website belongs to an official
government organization in the United States.
Secure .gov websites use HTTPS
A lock (
) or https:// means you've safely
connected to the .gov website. Share sensitive
information only on official, secure websites.
