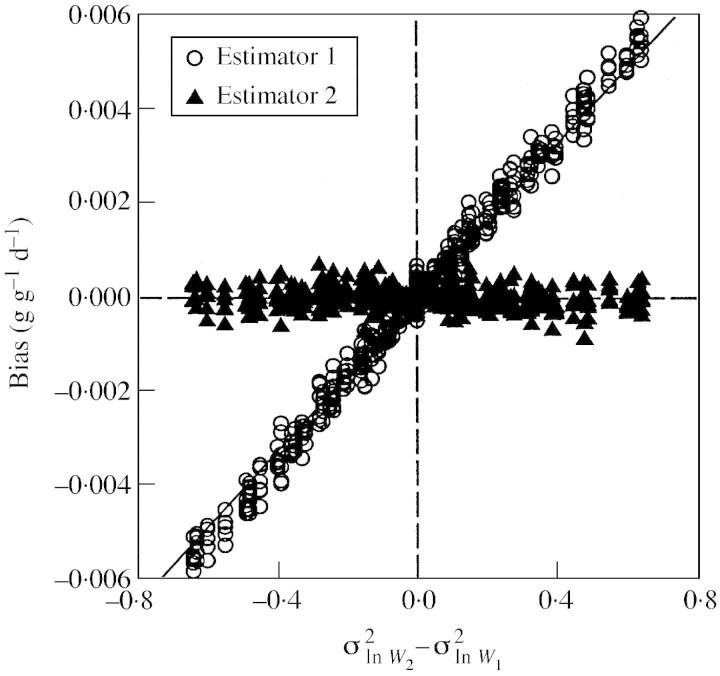
Fig. 1. Relationship between the difference in variance at two harvest times and simulated bias of the two RGR estimators. Results are from a fully factorial array of simulations using six levels of RGR (0·05, 0·10, 0·15, 0·20, 0·25, 0·30 g g–1 d–1) and eight levels each of and (0·1, 0·2, 0·3, 0·4, 0·5, 0·6, 0·7, 0·8). Each point represents the mean of 10 000 simulations with a sample size of ten individuals in each harvest. The continuous line shows the bias as estimated by eqn (5).

An official website of the United States government
Here's how you know
Official websites use .gov
A
.gov website belongs to an official
government organization in the United States.
Secure .gov websites use HTTPS
A lock (
) or https:// means you've safely
connected to the .gov website. Share sensitive
information only on official, secure websites.
