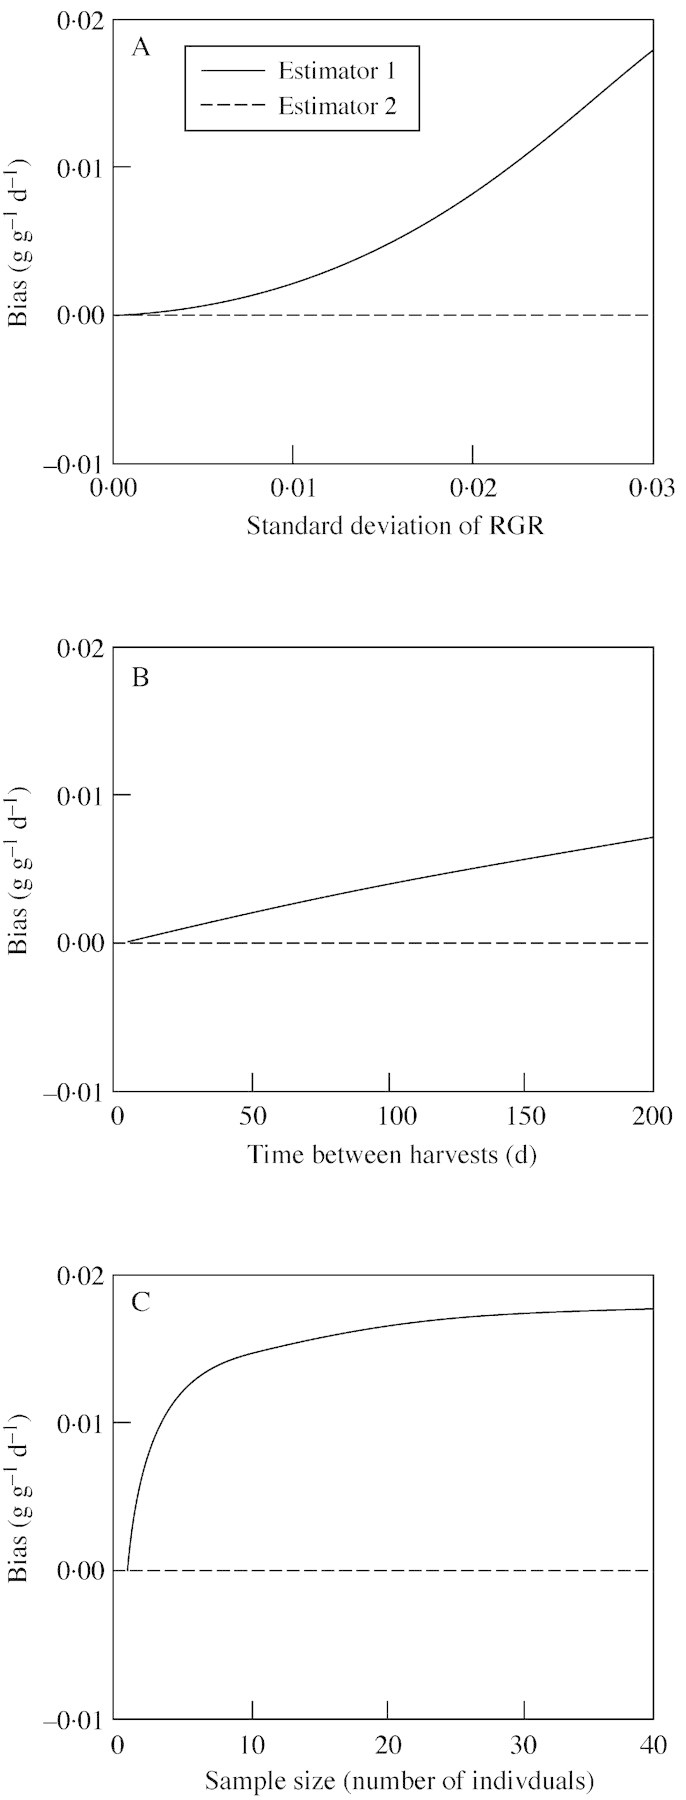
Fig. 2. Simulation results demonstrating the effect of variation in RGR (A), time between harvests (B) and sample size (C) on the bias of the two RGR estimators. In A, RGR was fixed at 0·05, with a harvest interval of 50 d and a harvest size of ten individuals. In B, RGR was fixed at 0·05 with a standard deviation of 0·01 and a sample size of ten individuals. In C, RGR was fixed at 0·05 with a standard deviation of 0·02 and harvest interval of 100 d. For each set of parameters, 10 000 simulations were run.
