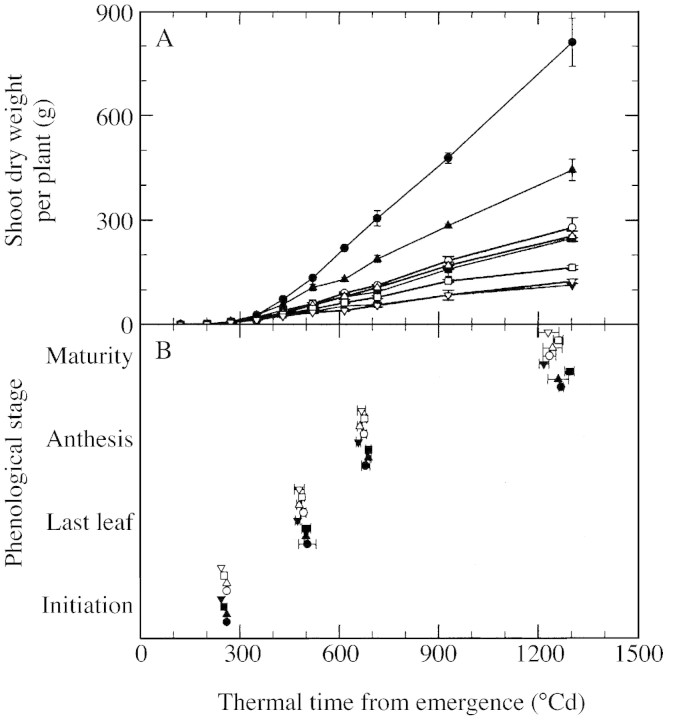
Fig. 2. Change in shoot dry weight (A) and phenological stages of main culms (B) with thermal time from emergence for tillering and uniculm plants. Data are presented for tillering (closed symbols) and uniculm (open symbols) plants, grown at densities of two (circles), four (upward pointing triangles), eight (squares) and 16 (downward pointing triangles) plants m–2. In B, phenological stages were floral initiation, ligule appearance of the final leaf, anthesis and grain maturity. Vertical lines in A and horizontal lines in B represent s.e.m. of three replications.

An official website of the United States government
Here's how you know
Official websites use .gov
A
.gov website belongs to an official
government organization in the United States.
Secure .gov websites use HTTPS
A lock (
) or https:// means you've safely
connected to the .gov website. Share sensitive
information only on official, secure websites.
