
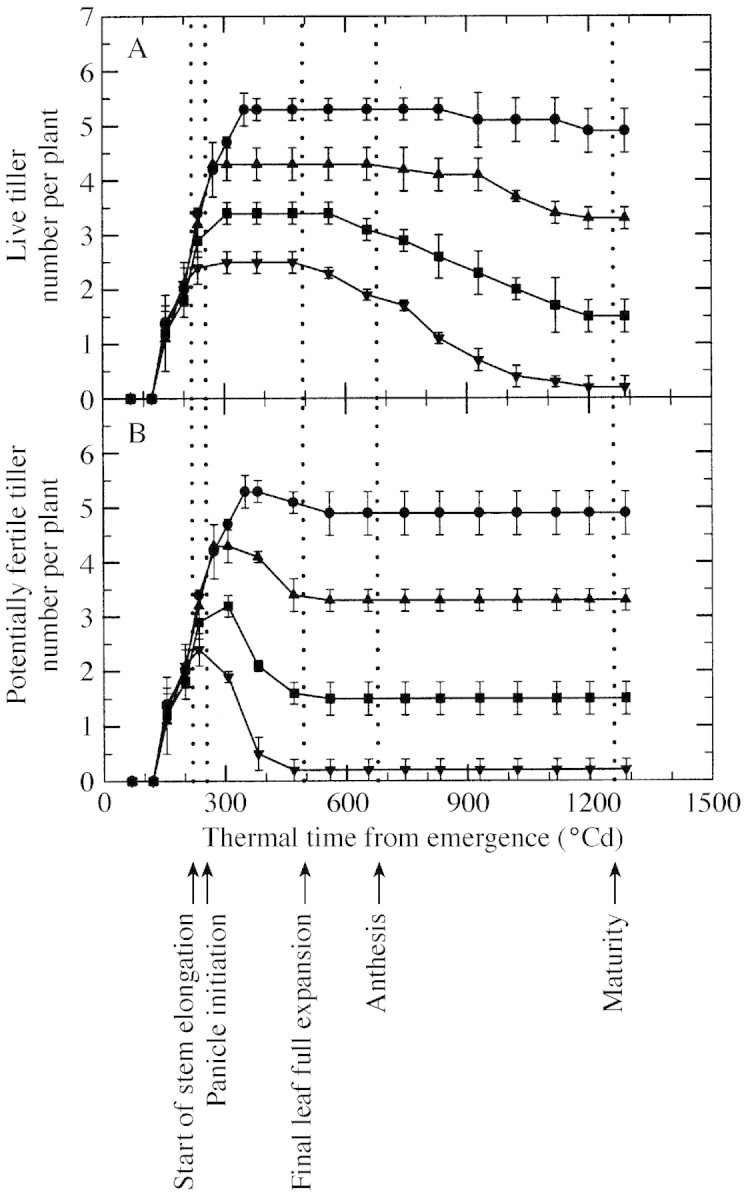
Fig. 3. Change with thermal time from emergence in number of live tillers per plant (A) and number of potentially fertile tillers per plant (B) for plants grown at a density of two (circles), four (upward pointing triangles), eight (squares) and 16 (downward pointing triangles) plants m–2. Vertical lines represent s.e.m. of three replications. Timing of phenological events indicated by dotted lines relates to the main culm.