
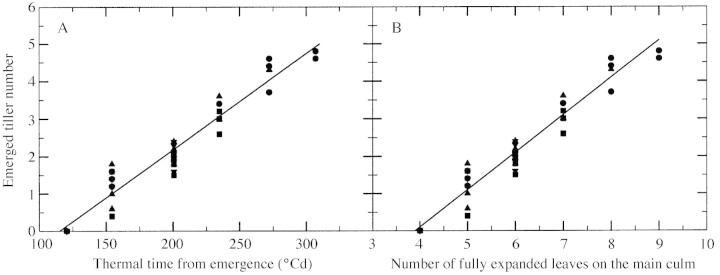
Fig. 4. Change in emerged tiller number with thermal time from emergence (A) and with number of fully expanded leaves on the main culm (B) using data from each of the three replications at a density of two (circles), four (upward pointing triangles), eight (squares) and 16 (downward pointing triangles) plants m–2 before cessation of tiller emergence had occurred. Solid lines show the corresponding linear regressions; slopes are 0·026 for (A) and 0·99 for (B).