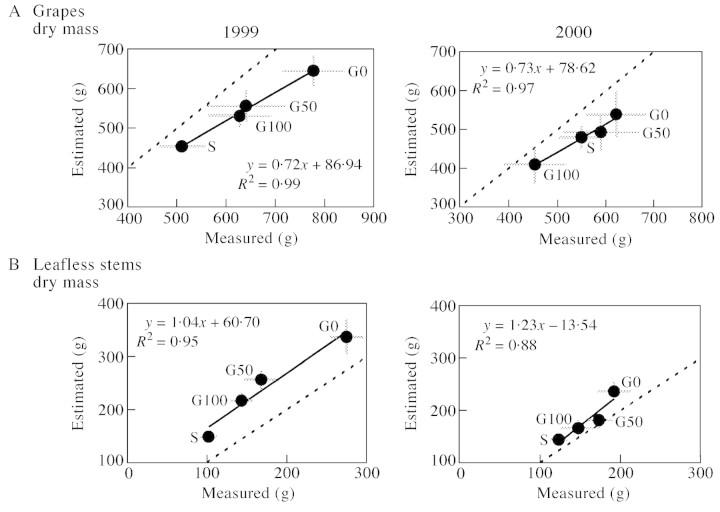
Fig. 6. Comparison of measured mean dry mass values per vine of grapes (A) or total stems (B) to predicted values estimated from multi‐year regression equations. (See Table 1 for more information concerning sampling calendar). G0, G50, G100 and S represent ungrassed, half‐grassed, fully‐grassed and gravelly soil plots, respectively. Vertical and horizontal bars represent s.e.m. Solid and dashed lines represent the least square regression and the 1 : 1 line between measured and predicted values, respectively.

An official website of the United States government
Here's how you know
Official websites use .gov
A
.gov website belongs to an official
government organization in the United States.
Secure .gov websites use HTTPS
A lock (
) or https:// means you've safely
connected to the .gov website. Share sensitive
information only on official, secure websites.
