
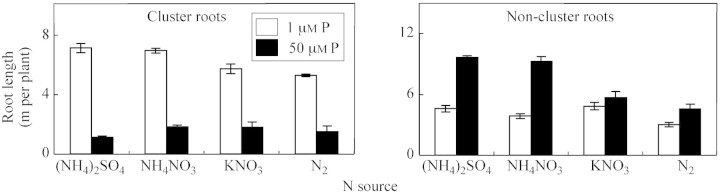
Fig. 3. Total length of cluster and non‐cluster roots of L. albus plants after 35 d of growth in nutrient solutions containing different N forms and P concentrations. Bars represent ± s.e. (n = 3).
Official websites use .gov
A
.gov website belongs to an official
government organization in the United States.
Secure .gov websites use HTTPS
A lock (
) or https:// means you've safely
connected to the .gov website. Share sensitive
information only on official, secure websites.
Fig. 3. Total length of cluster and non‐cluster roots of L. albus plants after 35 d of growth in nutrient solutions containing different N forms and P concentrations. Bars represent ± s.e. (n = 3).