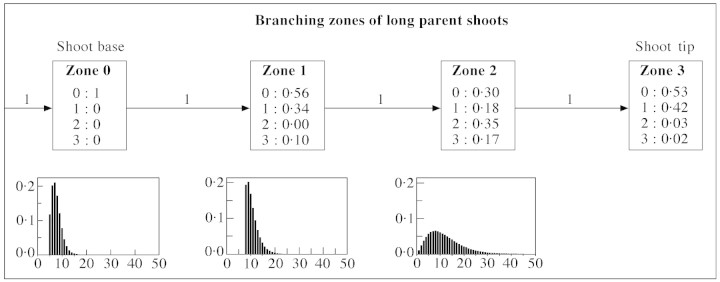
Fig. 9. Hidden semi‐Markov chain model representing branching pattern of long kiwifruit shoots. Boxes represent branching zones along the shoots, corresponding to the states of the model, with probabilities of different types of axillary production observed in each zone given within the zone boxes. The types of axillary production denoted by 0, 1, 2 and 3 correspond to latent bud, short shoot, medium shoot and long shoot, respectively. Arrows represent transitions between the zones with transition probabilities shown above. The far left arrow indicates that the initial state of the model corresponds to zone 0. The probability distributions for zone length measured in number of nodes are shown below the corresponding boxes.
