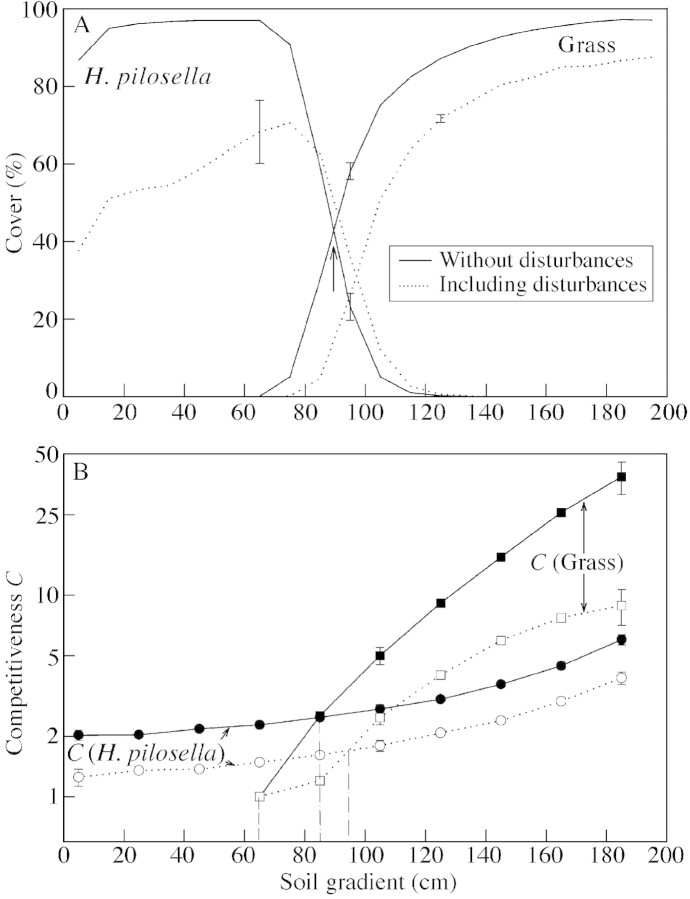
Fig. 4. Competition of Hieracium pilosella and grass in a gradient of soil fertility without (continuous line) and including (broken line) disturbance. A, Cover of competing species averaged over ten runs of 300 years computed for subsections along the soil gradient shown in Fig. 2. B, Competitiveness values C [eqns (1) and (3)]. The arrow in Fig. 4A denotes the point of intersection used for sensitivity analyses. The vertical dot‐dash lines in Fig. 4B indicate the points of intersection of the competitiveness values of the two species. They separate regions in a gradient of soil fertility where one species excludes the other in the long run. The vertical dashed line indicates the boundary for the presence of grass; left of it (CG < 1) grass cannot establish.

An official website of the United States government
Here's how you know
Official websites use .gov
A
.gov website belongs to an official
government organization in the United States.
Secure .gov websites use HTTPS
A lock (
) or https:// means you've safely
connected to the .gov website. Share sensitive
information only on official, secure websites.
