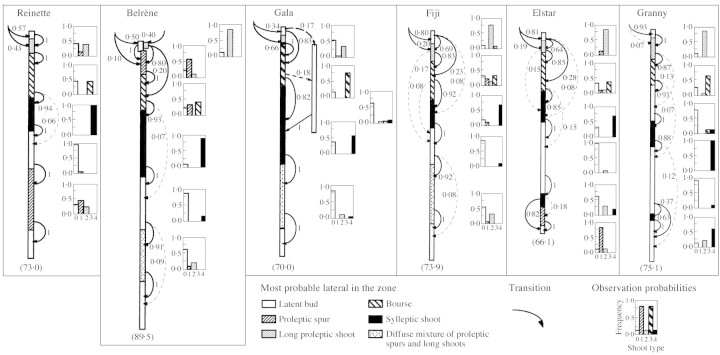
Fig. 6. Schematic representations of the hidden semi‐Markov chains estimated for each cultivar. The branching zones are represented by different motifs and their length corresponds to the mean value of the occupancy distribution. The observed lateral types are represented by histograms (except for the top and bottom zones where only latent buds are observed). The oriented edges represent the possible transitions between the zones and their respective probabilities are noted nearby. The mean total number of nodes is indicated in parentheses at the bottom of each diagram.

An official website of the United States government
Here's how you know
Official websites use .gov
A
.gov website belongs to an official
government organization in the United States.
Secure .gov websites use HTTPS
A lock (
) or https:// means you've safely
connected to the .gov website. Share sensitive
information only on official, secure websites.
