
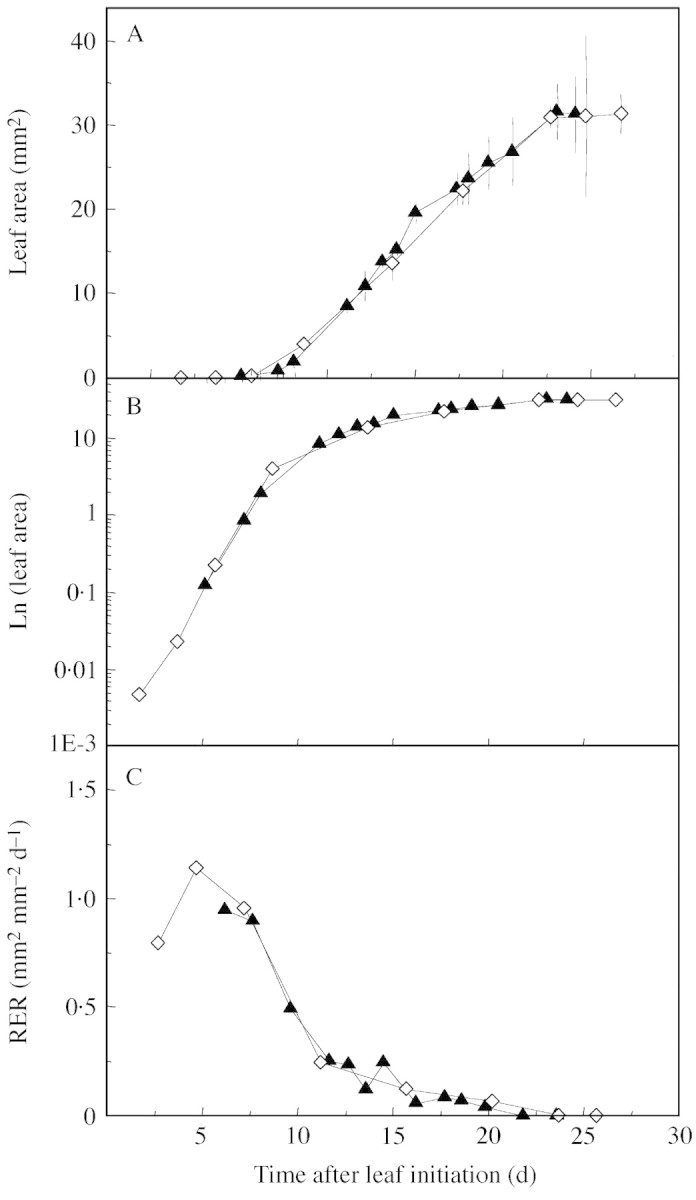
Fig. 4. Changes over time in the area of leaf 2 (A), in the area of leaf 2 on a logarithmic scale (B), and in the corresponding relative expansion rate (RER, C) for plants grown under similar temperatures and cumulative PPFD: either in soil (Gh‐21 °C, triangles), or in hydroponic conditions (Gc20·5 °C, diamonds). Vertical bars in A represent confidence limit at P < 0·05 (n = 5).