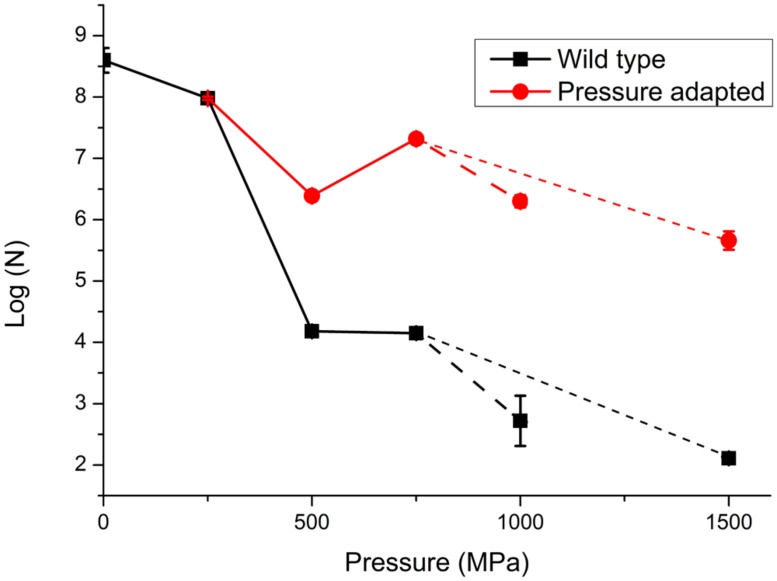
FIGURE 3.
Survivability of S. oneidensis MR-1 following exposure to high pressure extending up to 1000 MPa (1 GPa). Data are reported on a logarithmic scale with N as the number of CFUs per ml determined following recovery to ambient pressure. Data points represent averaged results from multiple experiments: individual run results are listed in Table 1. The point at 0.1 MPa (ambient pressure) represents the starting solution with initial concentration 108±0.5 cells/ml. The lines are sketched to show a link between data points. In a first series of experiments the WT strain was taken directly to each pressure of 250, 500, 750, and 1000 MPa in single steps. In further experiments the survivors following pressure exposure were cultured to form a “pressure adapted” population, that was then exposed to a next higher pressure step. The sequential process of pressure exposure, survivor culture, then subsequent exposure to higher pressure was repeated several times for different samples. Dashed lines extending to 1 GPa (larger dashed lines) and 1.5 GPa (smaller dashed lines) points represent different pathways for pressure exposure, survivor culture that were taken after 750 MPa, (pathway 1: 250, 500, 750, and 1000 MPa and pathway 2: 250, 500, 750, and 1500 MPa). Details of individual experiments are given in Table 1. Size of the data marker and error bars indicate the range of CFUs counted for each data point.

