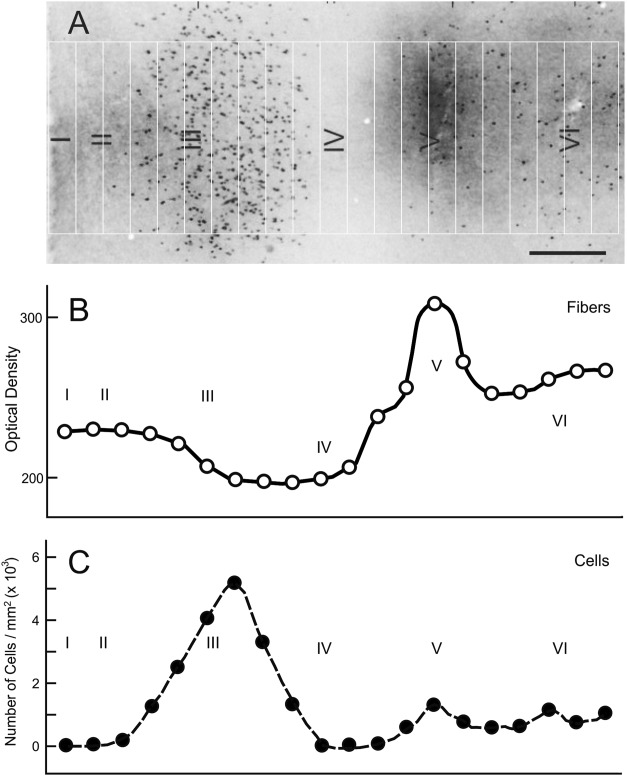
Figure 11.

Variation in the numbers of labeled cells and the densities of fibers in different cortical layers through a CytOx-rich thin band of V2 after injection of CTb into V4. The density of labeled cells peaks in layer III (5 cells/mm2), whereas the density of fibers is greater in layer V. The measurements were made in an oblique section divided into 21 rectangles of 534 × 70 μm. Scale bar = 200 μm.
