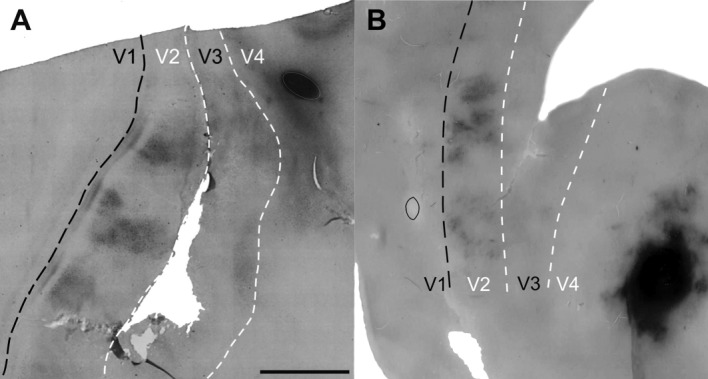
Figure 2.

A,B: Injections in V4 and projections to V2 in the flattened sections of two cases (case 1, A and case 2, B). Groups of cells and fibers are regularly spaced in V2 in both animals. Injections restricted to the visual area V4 are shown to the right of the sections in each animal. Black dashed lines show the V1/V2 border. White dashed lines show the estimated V2/V3 and V3/V4 borders. Scale bar = 5 mm in A (applies to A,B).
