Figure 3.

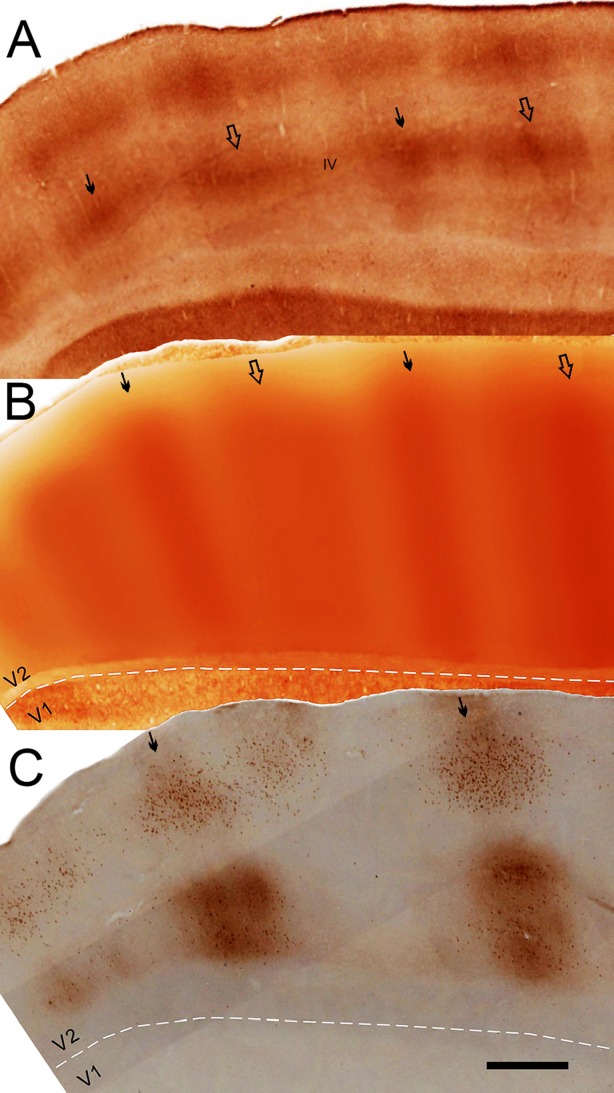
CytOx-bands and CTb-labeled cells and terminals in V2 from case 3. A–C: CytOx-stained oblique section of V2 (A), montage of layer IV of V2 from neighboring sections (B), and alternated neighboring CTb-stained sections (C) showing the corresponding locations of cells and terminals in relation to the CytOx-thin bands and interbands of V2. White dashed lines show the V1/V2 borders. Segments of layer IV of V2 from adjacent CytOx-stained sections were stacked together and filtered (Gaussian filter = 100 μm [30 pixels]) using Photoshop 7 to compose the montage shown in B. Cells and minimally dense CTb-staining are shown in clusters in the upper layers, and heavily dense fibers and cells are clustered in the lower layers. Thin solid arrows point to the location of thin CytOx-rich bands in B and C and in layer IV in A. Thick open arrows point to the location of thick CytOx-rich bands in B and C and in layer IV in A. Scale bar = 1 mm in C (applies to A–C).
