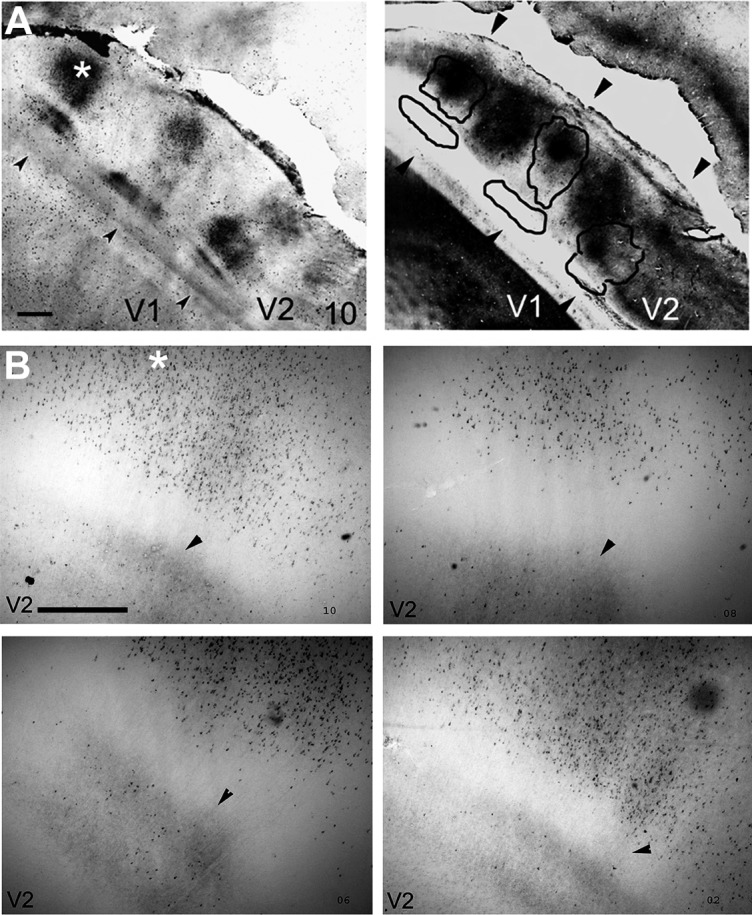
Figure 5.

CTb-stained cells and fibers from the thin CytOx-rich band and inter-bands in V2 from Case 4. A: Low-power photomicrograph of section 10, showing V2 stained for CTb (left) and CyOx (right), with a CytOx-rich band of V2 (black lines). B: Enlarged photomicrographs obtained from adjacent tangential sections (10, 08, 06, and 02) showing CTb-labeled cells and terminals. The arrowheads mark blood vessels used to align the photomicrographs. The location of the high-power photomicrographs corresponds to the site marked with an asterisk on the left side of A. Scale bar = 1 mm in A and B.
