Figure 7.

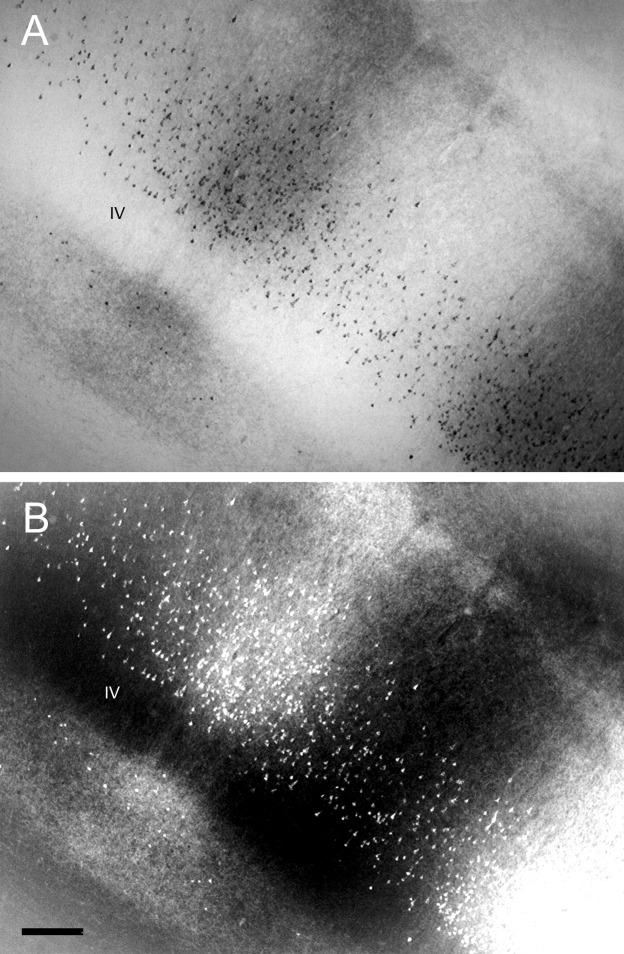
A,B: Brightfield (A) and darkfield (B) photomicrographs of labeled cells and fibers in V2 after an injection of CTb in V4 in case 1. Scale bar = 200 μm in B (applies to A,B).

A,B: Brightfield (A) and darkfield (B) photomicrographs of labeled cells and fibers in V2 after an injection of CTb in V4 in case 1. Scale bar = 200 μm in B (applies to A,B).