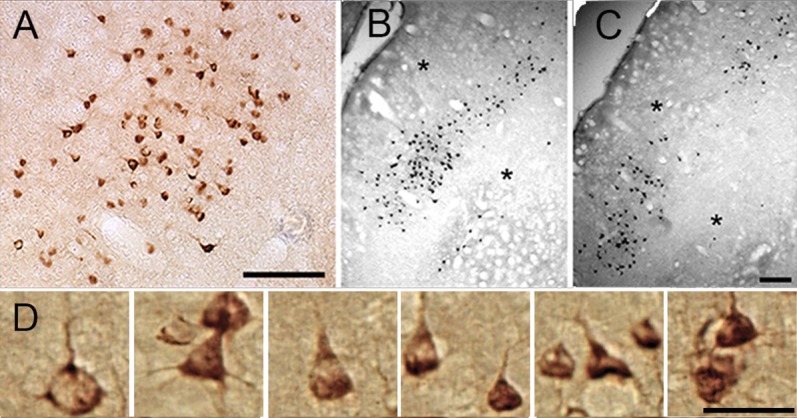
Figure 8.

Types of cells that were CTb-labeled in oblique sections of V2. A: Enlarged colored photomicrograph of CTb-labeled cells in layer III in V2. B,C: CTb-immunoreacted sections showing clusters of labeled cells in the upper layers of V2. Asterisks indicate corresponding blood vessels. D: Cell types exhibiting feedforward projections in layer III of V2. Enlarged photomicrographs show the labeled cells in V2 after an injection of CTb in V4. Scale bar = 200 μm in A, C (applies to B,C), and D.
