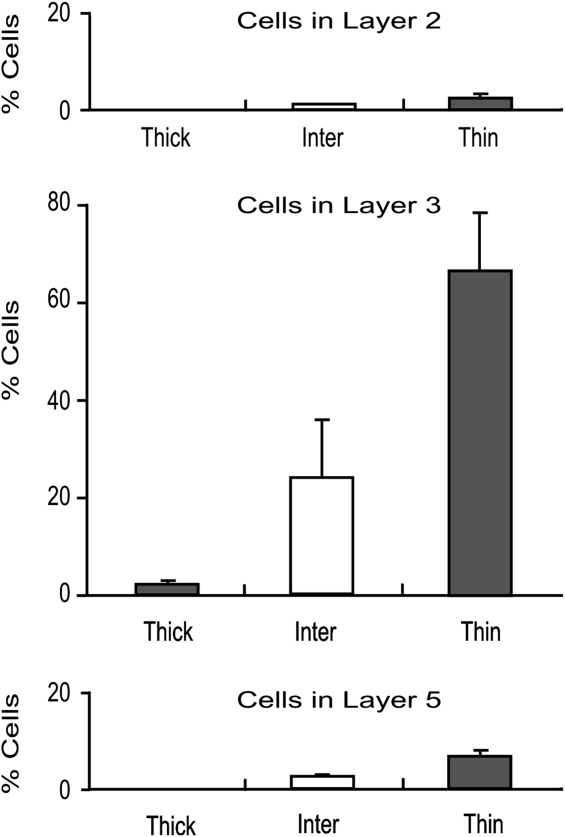
Distribution of cells in CytOx modules and cortical layers. Mean relative frequency of cells in layers II, III, and V of V2 after injections of CTb into V4. Whiskers represent 1 SD.

Distribution of cells in CytOx modules and cortical layers. Mean relative frequency of cells in layers II, III, and V of V2 after injections of CTb into V4. Whiskers represent 1 SD.