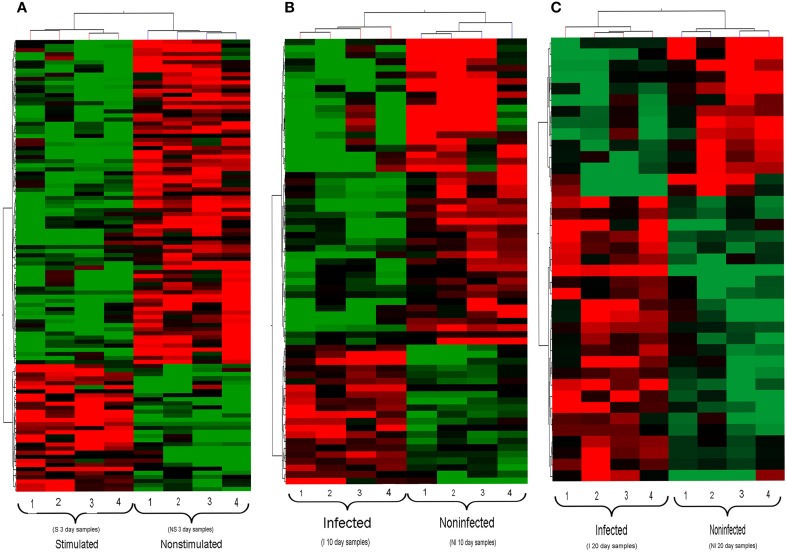
Figure 3.
Hierarchical clustering of Wigglesworthia genes. For (A–C), each group of flies is comprised of 4 replicates. (A) Genes from stimulated and non-stimulated tsetse flies, 3 days after ingestion of a trypanosome-infected blood meal or non-infected meal, respectively. (B) Genes from infected and non-infected tsetse flies, 10 days after ingestion of a trypanosome-infected blood meal. (C) Genes from infected and non-infected tsetse flies, 20 days after ingestion of a trypanosome-infected blood meal. The set of Wigglesworthia genes was extracted from the full data set (673 genes and 5115 probes) using a t-test (p < 0.05). The two-dimensional hierarchical cluster was performed on the basis of the gene expression profiles of each sample, using the GeneSpring GX software (version 12.0). Each row represents one Wigglesworthia gene and each column represents one Wigglesworthia sample. The intensity of the red and green colors, respectively up- and down-regulated genes, indicates the corresponding expression levels.

