Figure 1.

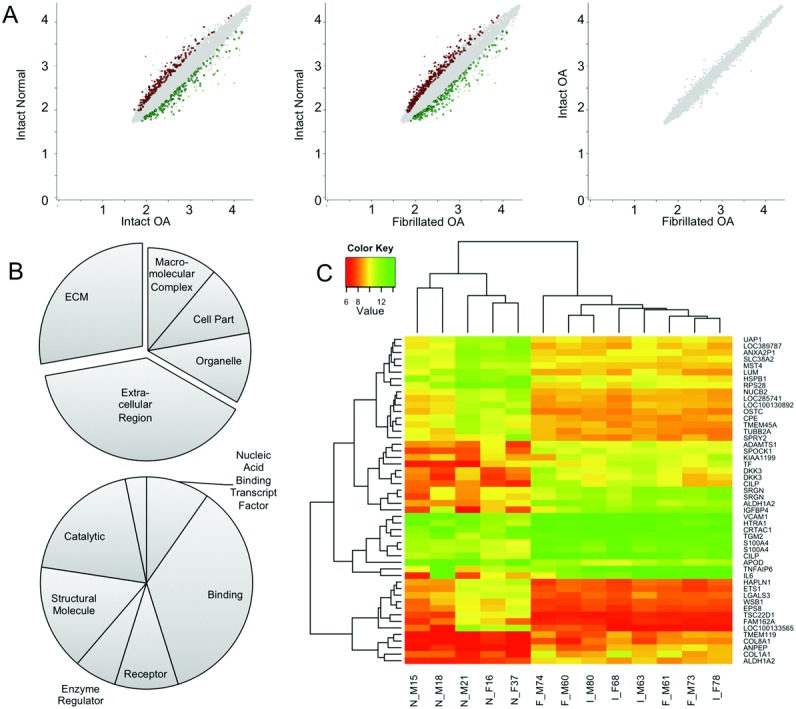
A, Scatterplots demonstrating the relationships between log2 gene expression levels between normal chondrocytes, intact osteoarthritic (OA) chondrocytes, and fibrillated OA chondrocytes (green and red dots represent genes that exhibit change between groups with P < 0.01). B, Pie charts representing the occurrence of major ontological annotations associated with genes significantly up-regulated and down-regulated in OA chondrocytes, either in location (top) or in process (bottom) categories of the Panther Classification System. Exploded regions on charts emphasize the number of extracellular-associated genes differentially regulated. C, Heatmap representing expression levels of the top 25 up-regulated and the top 25 down-regulated genes in OA chondrocytes. Both the gene and sample lists were subjected to hierarchical clustering. Color key indicates the normalized log2 hybridization values. Average histologic scores of samples at the bottom are shown in Table1. ECM = extracellular matrix.
