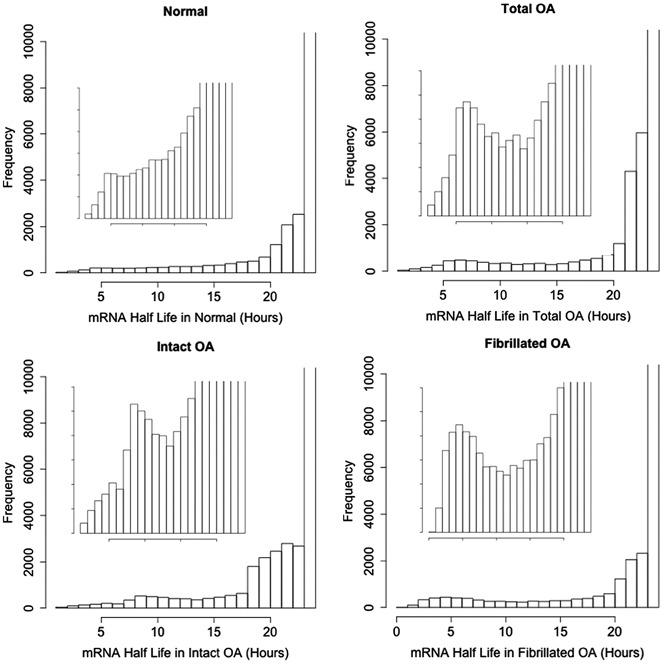
Figure 2.

Profile of mRNA half-life in normal and osteoarthritic (OA) chondrocytes and in OA chondrocytes stratified into those isolated from intact OA and fibrillated OA tissue. The analysis caps longer half-lives at 24 hours, which accounts for the high peak at the far right in each panel (which extends beyond the limit of the y-axis in each case). Inserts show the same data on zoomed y-axis.
