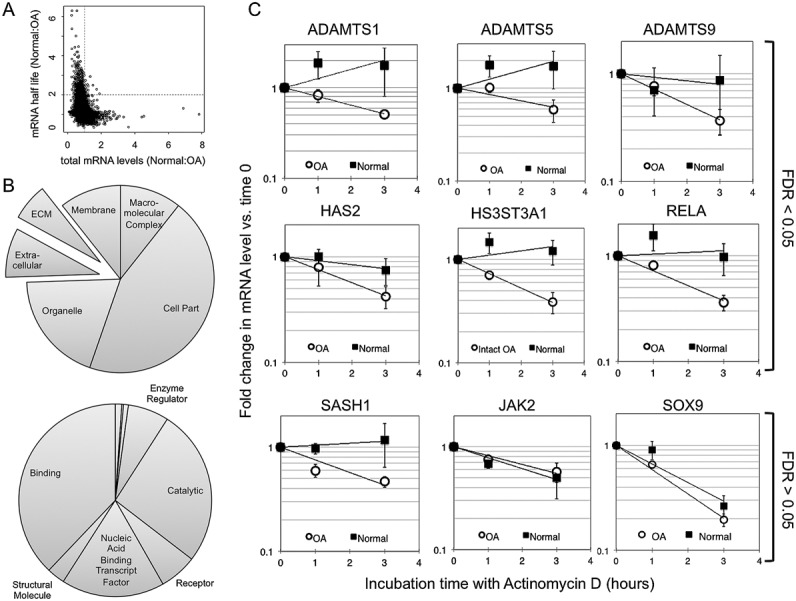
Figure 3.

Effect of osteoarthritis (OA) on mRNA decay. A, Scatterplot relating the observed fold change in total mRNA levels between normal and OA cells to the fold change in mRNA half-life. The vertical line represents a normal:OA total mRNA ratio of 1:1, such that all points to the left of the line represent genes with increased expression in OA. The horizontal line represents a 2-fold change in the normal:OA mRNA half-life ratio, such that genes that are above this line are less stable in OA cells. B, Pie charts representing the occurrence of major ontological annotations associated with genes significantly up-regulated and down-regulated in OA chondrocytes, either in location (top) or in process (bottom) categories of the Panther Classification System. Exploded regions on charts emphasize the number of extracellular-associated genes differentially regulated. C, Real-time reverse transcription–polymerase chain reaction analysis of mRNA decay, confirming alterations between normal and intact OA chondrocytes in mRNA decay of selected genes. Values are mean ± SEM fold change in mRNA levels compared to 0 hours of the decay curve (data from 5 normal donors and 5 OA donors; see Table1). Data are presented for 6 genes in which the false discovery rate (FDR) was <0.05 in microarray analysis and for 3 genes in which the average half-life was altered but the FDR was >0.05. ECM = extracellular matrix.
