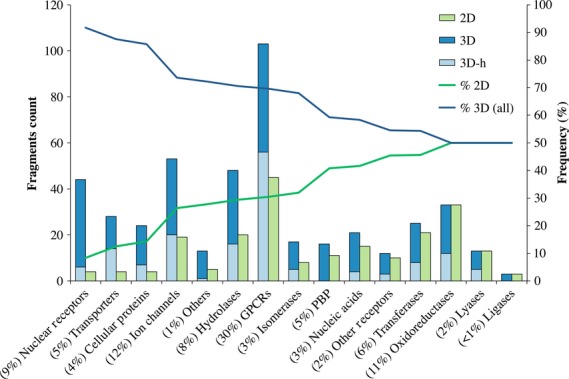
Figure 6.

Number and percentage of 2D and 3D rings per each target class. Values in parentheses next to the target categories are the percentage distribution of targets among the marketed drugs analyzed. On the abscissa, the number of rings (left) and their percentage (right) in the target class.
