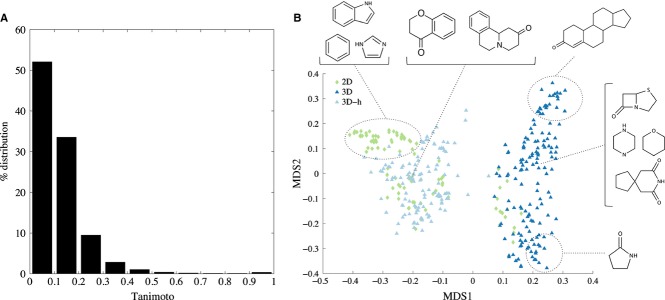
Figure 7.

(A) Percentage distribution of Tanimoto scores for the whole set of non-redundant fragments. (B) The first 2 dimensions of the multidimensional scaling (MDS) map of fragments. Three dimensional fragments are denoted by blue triangles and 2D fragments by green diamonds. Some example molecules are shown, representing the structural characteristics of the fragments found in different clusters. Notice the wider spread of 3D fragments on the map, suggesting a higher skeletal diversity.
