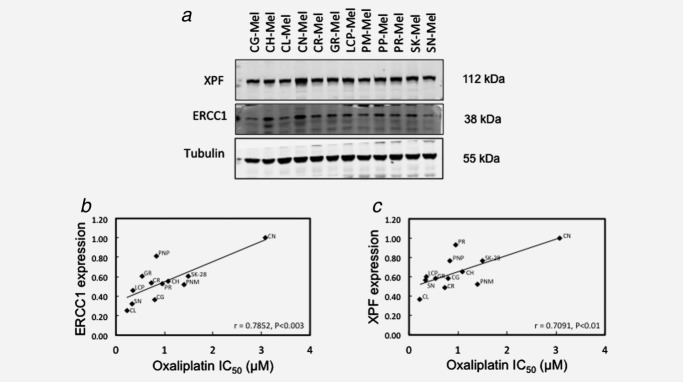
Figure 3.

Significant correlation between protein levels of XPF or ERCC1 and oxaliplatin sensitivity in human MM cells. (a) Protein extracts from 12 MM cell lines were probed for XPF and ERCC1 levels by Western blotting. Oxaliplatin IC50 values were determined by clonogenic assays. Briefly, melanoma cells were exposed to graded concentrations of oxaliplatin for 24 hr. After 10–11 days of incubation in the absence of the drug, colonies were fixed and stained with crystal violet for visualization. Only those colonies containing 50 or more cells were scored as survival colonies. IC50 values were calculated on the regression line in which colony formation efficiency was plotted against the logarithm of drug concentration. Protein expression levels were quantified by Odyssey image analysis (Li-cor Biosciences, Cambridge, UK) for ERCC1 (b) and XPF (c), corrected for tubulin expression and plotted against oxaliplatin IC50 values determined in the cell lines and the correlation measured (n = 3). Oxaliplatin IC50 values were determined by clonogenic assays.
