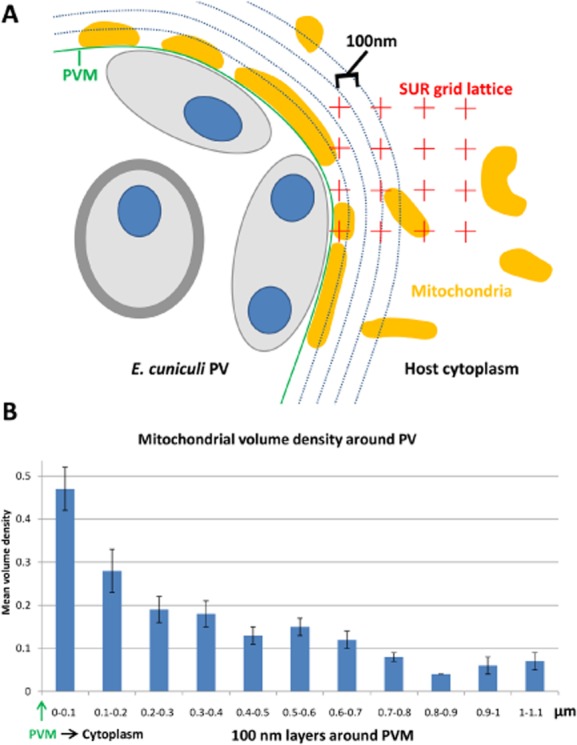
Figure 2.

Gradient of mitochondrial volume density around the PVM. Volume density was estimated using point counting and surface fraction by intersection counts on micrographs containing regions of E. cuniculi PVs (see Experimental procedures).A. Schematic depiction of 100 nm layers surrounding the PVM (only 4 layers shown) used for the volume density estimates of mitochondria in the experiment. The SUR grid lattice is represented illustratively and would extent over the whole area of the micrographs.B. Estimated mean volume density of mitochondria within 100-nm-wide shells around the PV. The highest volume density of mitochondria could be detected in the first 100 nm layer around the PV (0.47, SEM 0.05) followed by a 40% step-wise decrease in volume density in the second 100 nm layer (0.28, SEM 0.05) indicating that mitochondria form a single layer of profiles around the PVM by direct binding rather than mere clustering. Error bars indicate the SEM.
