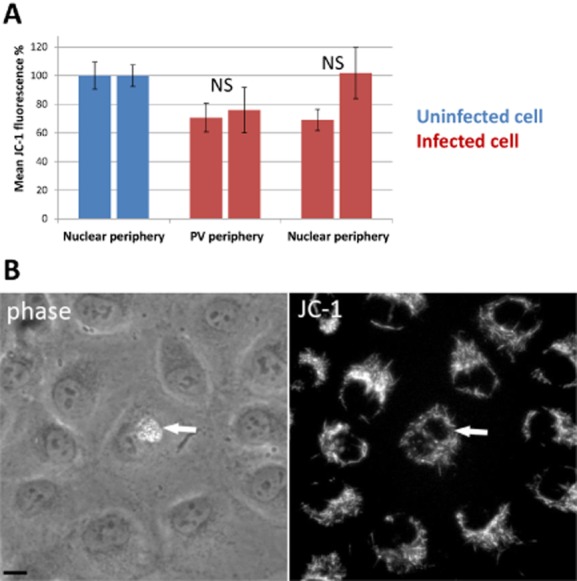
Figure 6.

In situ assessment of mitochondrial membrane potential in E. cuniculi-infected RK cells using the membrane-permeable dye JC-1.A. Quantification of the fluorescent intensity of JC-1 indicating levels of mitochondrial membrane potential in uninfected compared to infected cells from two individual experiments. The fluorescent intensities were normalized in relation to the mean level of JC-1 fluorescence in uninfected cells. Measurements were made adjacent to either the nucleus or PV (see Experimental procedures). The global membrane potential is decreased by about 20% in infected cells. The mitochondrial activity was comparable in regions adjacent to the PV compared to locations adjacent the nucleus, indicating that E. cuniculi has no direct influence on the local levels of ATP production. Error bars indicate the SEM. The results for non-infected cells (n = 19) compared to juxta-PV locations (n = 12) or juxta-nuclear locations (n = 12) in infected cells were not statistically significant (NS; P values > 0.05 using the Mann–Whitney test).B. JC-1 fluorescence in RK-13 cells. The white arrow highlights a cell infected with E. cuniculi. A PV containing numerous cell stages of the parasite can be seen. The fluorescence of JC-1 appears evenly distributed in the infected cell. Note the higher intensity of JC-1 in uninfected cells in the same frame. Phase = phase contrast; bar 10 μm.
