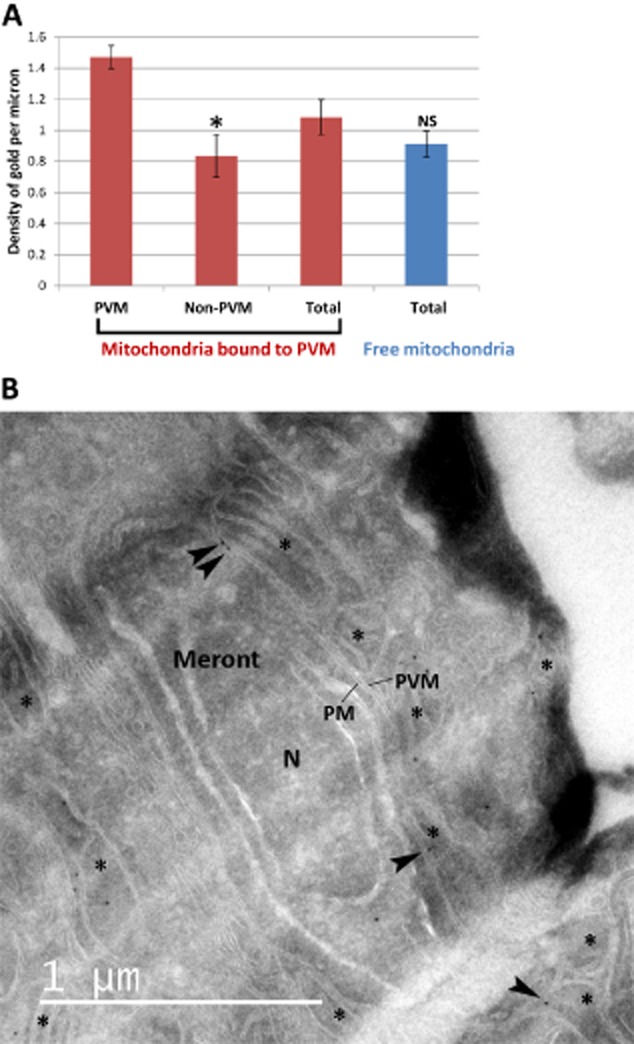
Figure 7.

Quantification of the density of VDAC in mitochondria bound to the PV in thawed cryo-sections of E. cuniculi-infected RK-13 cells. Cryo-sections were labelled with an antibody against the mitochondrial porin, VDAC. Micrographs were taken at regions containing the PVM.A. Mean densities of VDAC gold labelling from five individual experiments. The membrane boundary lengths of interest were estimated using intersection counting (see Experimental procedures) and counts of 10 nm protein-A gold made. As a control the VDAC signals in the endoplasmic reticulum and the plasma membrane were also estimated in three initial experiments producing an estimated gold particle density of 0.0205 (138 to 179 intersection counts; SEM 0.0046) and 0.0156 (46 to 68 intersection counts; SEM 0.0081) for the ER and the PM respectively. No gold particles were detected over profiles of the Golgi apparatus and over the plasma membrane of the parasites. Error bars indicate the SEM. Labelling density over juxta-PV membranes was significantly higher (*) than labelling density over PV-free membranes belonging to the same mitochondria (Mann–Whitey test, P ≤ 0.01, n = 5 in each case). When the ‘global’ gold labelling density over PV-bound mitochondria was compared to that over mitochondria free in the cytosol the difference was not significant (NS) using the Mann–Whitney test (P > 0.05; n = 5 in each case).B. Micrograph representative of the quantitative data displaying a meront with several mitochondria bound to the PVM. VDAC positively labelled with gold particles at the PVM–OMM interaction site is highlighted with black arrowheads. Asterisks, mitochondria; N, nucleus of meront; PM, plasma membrane of meront; PVM, parasitophorous vacuole membrane.
