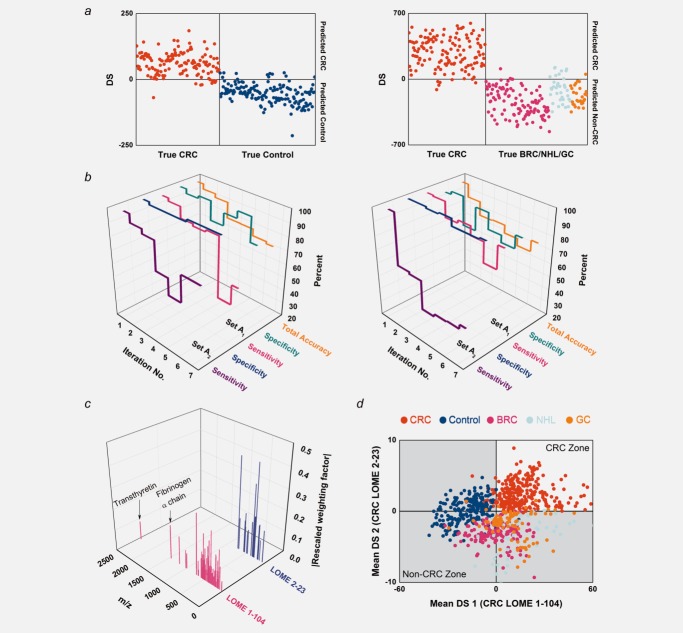
Figure 2.
LOME construction procedures. (a) Classification results for Set A0 and the excluded cases with CRC LOMEs comprising LMIs selected by Algorithm 1. Set A0 and the excluded cases coincide with Set A1. Left: CRC vs. control (CRC LOME 1-278). Right: CRC vs. BRC/NHL/GC (CRC LOME 2-383). (b) Classification parameters of biomarker groups found by iteratively applying Algorithm 2. “Total accuracy” is the proportion of TPs and TNs in Set A. Left: CRC LOME 1. Right: CRC LOME 2. (c) Discriminative biomarker LMIs (104 and 23 for CRC LOMEs 1 and 2) and their associated weighting factors. The weighting factors for the selected LMIs in each LOME were rescaled for comparison so that their mean square value was unity. (d) Classification results for Set A with CRC LOMEs 1-104 and 2-23. Every sample was run in quintuplicate. All classification decisions were made using the mean DS.

