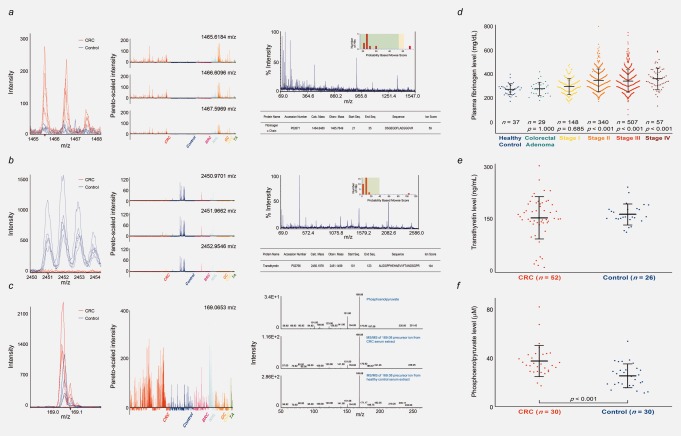
Figure 4.
Identification and quantification of monoisotopic LMIs with 1465.6184 and 2450.9701 m/z and nonmonoisotopic LMI with 169.0653 m/z in the methanol/chloroform serum extracts. (a) Mass spectra of 1465.6184, 1466.6096 and 1467.5969 m/z. Left: Intensities of CRC and control samples. Middle: Pareto-scaled intensities of all samples. Right: Identification of the fibrinogen α chain. “% Intensity” of the ion with highest signal intensity in the given MS/MS spectrum was defined as 100. The positive ion with 1465.6184 m/z was unambiguously identified as fibrinogen α chain based on MS/MS (see online Supporting Information Methods for details). (b) Mass spectra of 2450.9701, 2451.9662 and 2452.9546 m/z. Left: Intensities of CRC and control samples. Middle: Pareto-scaled intensities of all samples. Right: Identification of transthyretin. MS/MS analysis identified the positive ion with 2450.9701 m/z as a transthyretin. (c) Mass spectra of 169.0653 m/z. Left: Intensities of CRC and control samples. Middle: Pareto-scaled intensities of all samples. Right: Identification of LMI with 169.0653 m/z as a PEP by MS/MS. (d) Plasma fibrinogen levels in healthy individuals and patients with CRC or colorectal adenoma. Error bar represents the mean ± standard deviation. The p values were given for the comparison of each with healthy individuals by Scheffe’s post hoc test. (e) Transthyretin levels in CRC patients and healthy individuals. (f) PEP levels in CRC patients and healthy individuals. The p value was given by Mann–Whitney U-test.

