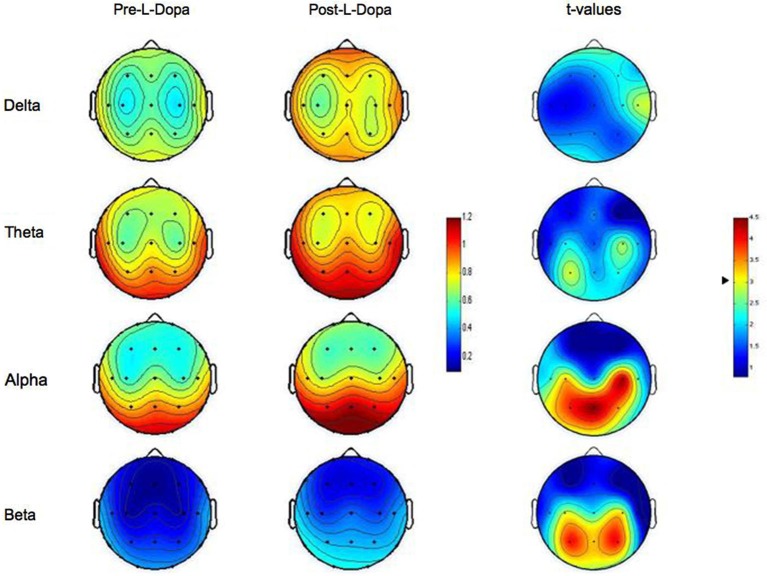
Figure 1.
Topographic statistical distribution of the change in resting wake EEG power, assessed by comparing (t-tests) Pre- and Post- L-dopa administration separately for different frequency bands (Delta, Theta, Alpha, Beta). Values are expressed in terms of both spectral power (left color-bar) and t-values (right color-bar). With respect to t-values, the higher the values, the stronger the prevalence of the Post- over the Pre-L-dopa condition. The two tailed level of significance (p = 0.006 after the Bonferroni correction, corresponding to a t = 3.01) is indicated by the arrow in correspondence of the t-values color bar. Average values are normalized by total power, color-coded, plotted at the corresponding position on the planar projection of the scalp surface and interpolated between electrodes. The maps are based on the 19 unipolar EEG derivations of the international 10–20 system with averaged mastoid reference.

