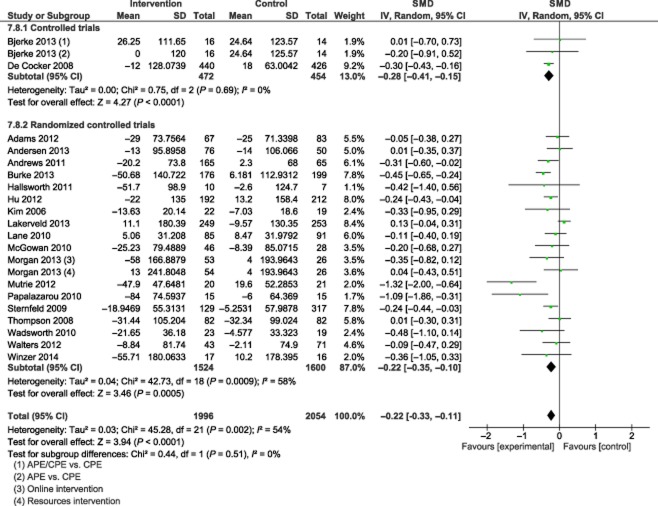
Figure 3.
Forest plot of standardized mean differences of sedentary time (min/d) from physical activity interventions. APE, activities-based education courses; CI, confidence interval; CPE, conceptually based courses; df, degrees of freedom; SD, standard deviation; SMD, standardized mean differences.

