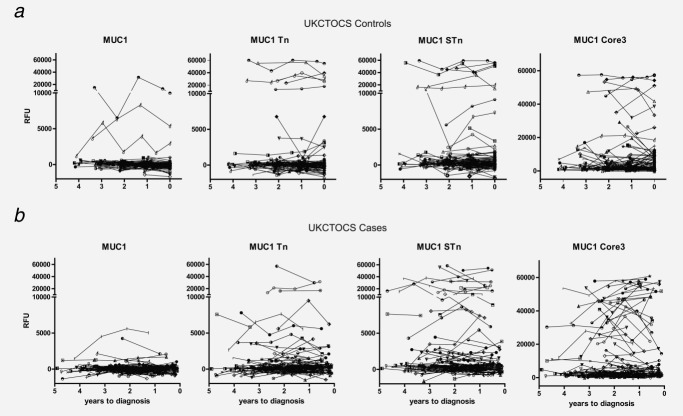
Figure 3.
Autoantibodies in prediagnostic serial samples from colorectal cancer patients (n = 97) and serial samples from controls (n = 94) to MUC1 glycopeptides. Each graph represents the autoantibody reactivity to MUC1 glycopeptides. Each symbol represents a single control or case individual. (a) Number of years to final serum sample taken is indicated for the controls on the x-axis, and (B) number of years before diagnosis for the cases is indicated on the x-axis. y-Axis represents relative fluorescence units (RFUs).

