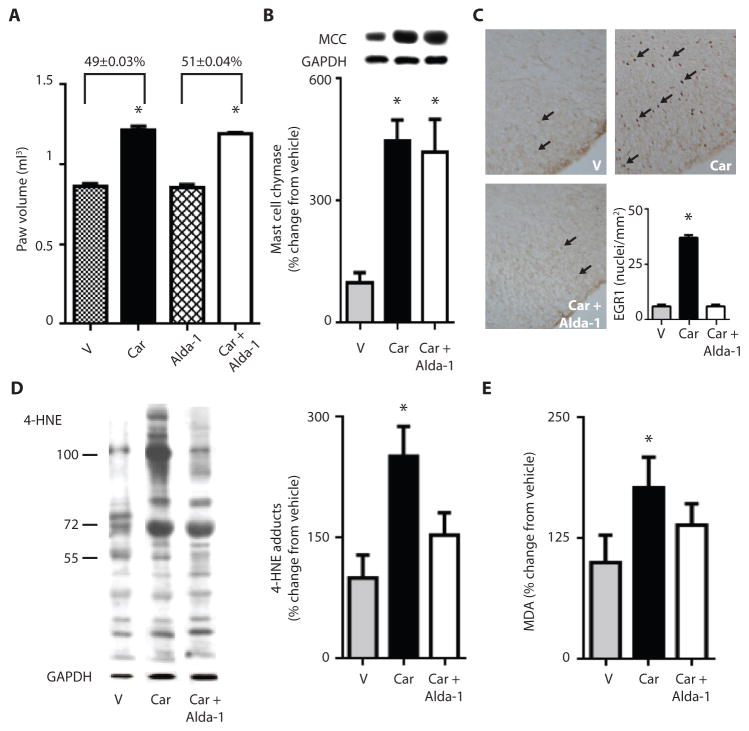
Figure 4. Effect of ALDH2 activation by Alda-1 on aldehydic load and hyperalgesia.
For A–E, rats were subjected to the protocol described in Fig. 3A, and all analyses were carried out 3 hours after carrageenan-induced insult by an observer blinded to the experimental conditions. A. Paw volume 3 hr after carrageenan injection. B. Mast cell chymase in the paw after carrageenan injection. C. Histological analysis of slices stained for EGR1, a marker of hyperalgesia in the dorsal horn superficial laminae for L4-L6 regions of the spinal cord. (n=6 animals/group, expressed as number of positive nuclei counted per mm2). D. A representative Western blot for 4-HNE protein adducts in the paws of vehicle- (V), carrageenan- (Car) and carrageenan + Alda-1- (Car+ Alda-1) treated groups. (n=5–6 biological replicates/group). E. Malondialdehyde (MDA) levels assessed as percent change relative to naïve rats as assessed by TBARs assay. (n=6 biological replicates/group). All data are expressed as mean±SEM, *P<0.01 versus vehicle, †P<0.05 compared to vehicle assessed by ANOVA with Tukey’s correction.

