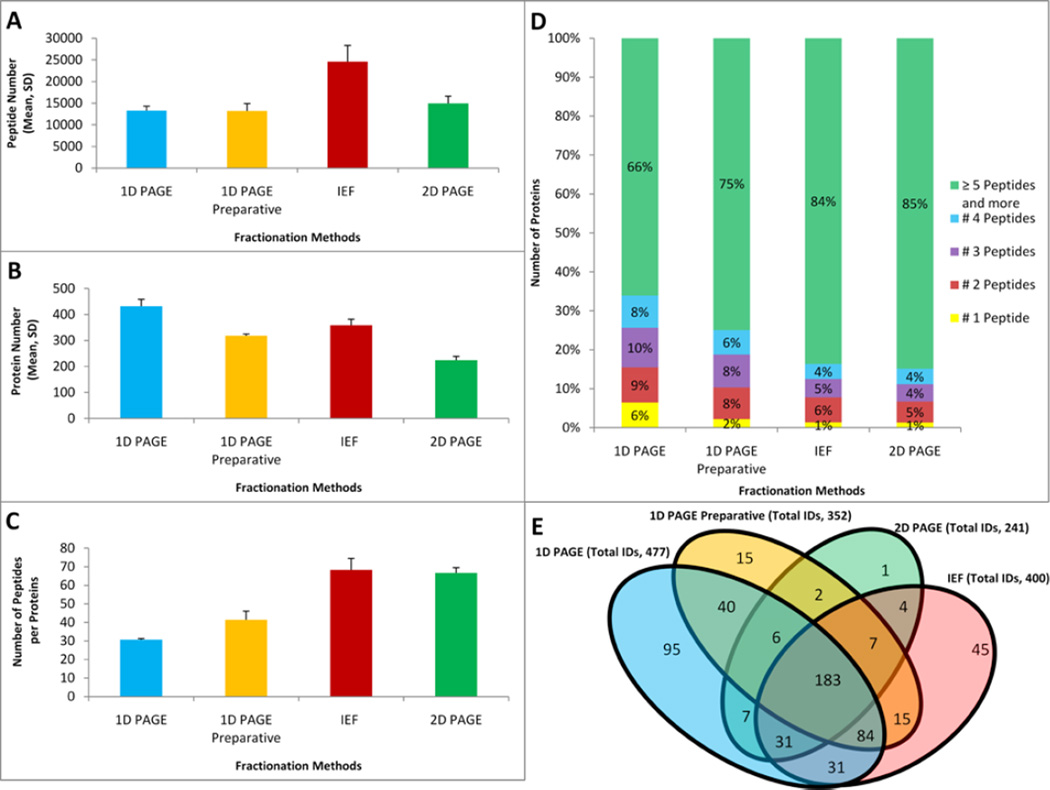
Figure 3.
Comparisons of the fractionation techniques in the resulting depth of LC-MS/MS proteomic profiling of mitochondria fractions extracted from rat liver. Profiling results are demonstrated using three different metrics: mean number of total identified peptides (A), identified proteins (B), and peptide per protein ratio (C) for each fractionation technique. All fractionation experiments were performed using 144 µg of total protein and each LC-MS/MS replicate consumed a 25% aliquot of a sample. Error bars illustrate standard deviations between LC-MS/MS replicate runs. (D) Fractions of proteomes corresponding to the mean numbers of peptides per protein identification. (E) Venn diagrams demonstrating unique and overlapping proteins of proteomes recovered by each fractionation technique.

