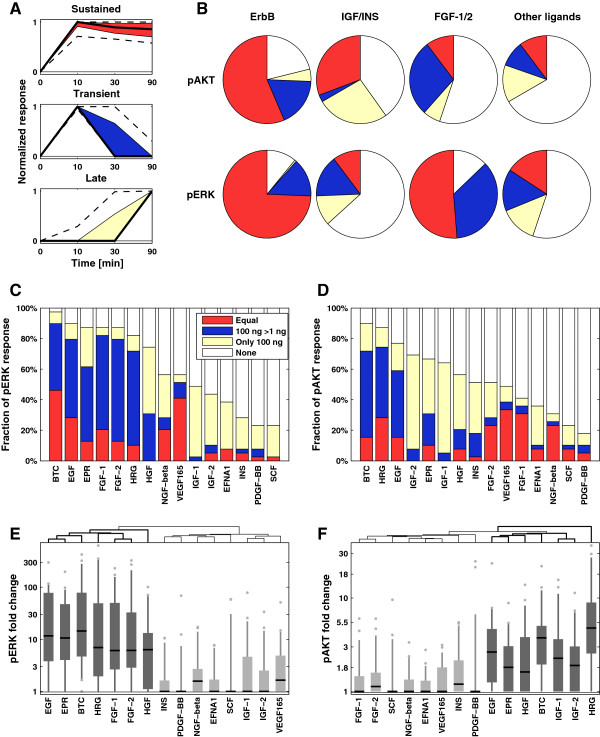
Figure 2.

Ligands elicit different response kinetics and exhibit distinct dose-response behavior. (A) Clustered response trajectories (red: sustained; blue: transient; off-white: late). Black lines represent the median response and colored zones the interquartile range; dashed lines depict 10% and 90% quantiles. (B) Distribution of all responses by ligand family and downstream target for ErbB ligands, IGF/INS ligands, FGF-1/2 and all remaining ligands (data for 100 ng/ml are shown). (C-D) Distribution of sensitivity classes by ligands for pERK (C) and pAKT (D): ‘Equal’ means that the fold-change response at low dose is at least 75% of the high dose response; ‘100 ng >1 ng’ means that low dose response is statistically significant but less than 75% of the high dose response; off-white means only the high dose response is significant. (E-F) Distribution of fold-change response by ligand, clustered by strength of the pERK (E) or pAKT (F) response at high ligand levels. Black lines represent the median, shaded zones the interquartile range, dashed lines the 5% and 95% quantiles, and dots the outliers. Darker gray is used for the clusters with the strongest responses.
