Figure 4.

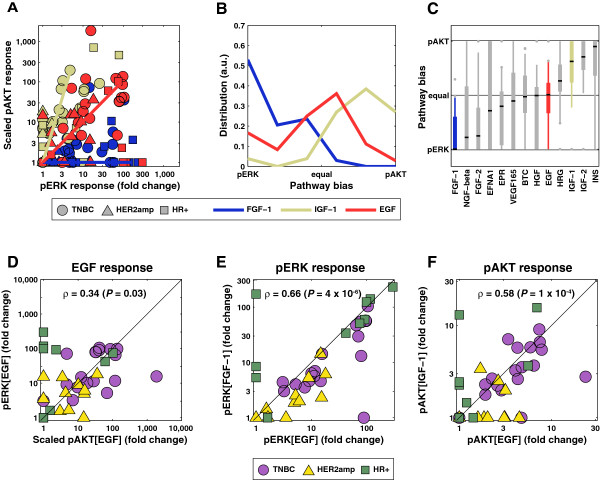
Bias in response towards pERK or pAKT varies with ligand and cell line. (A) Scaled pAKT (vertical axis) and pERK (horizontal axis) responses in cells exposed to 100 ng/ml IGF-1 (off-white), EGF (red), or FGF-1 (blue) with shape denoting subtype. (B) Distribution of the “pathway bias” for the three ligands in (A) where the bias is defined as the arctangent of the scaled pAKT to pERK fold-change ratio. (C) Distribution of the pathway bias for all ligands that exhibited at least 50% significant responses across all cell lines (at 100 ng/ml). Ligands are sorted according to the median of their pathway bias. (D-F) Scatter plot of pAKT and pERK responses to EGF (D), pERK responses to EGF and FGF-1 (E), and pAKT responses to EGF and IGF-1 (F). Spearman’s correlation and P-value are reported.
