Figure 5.

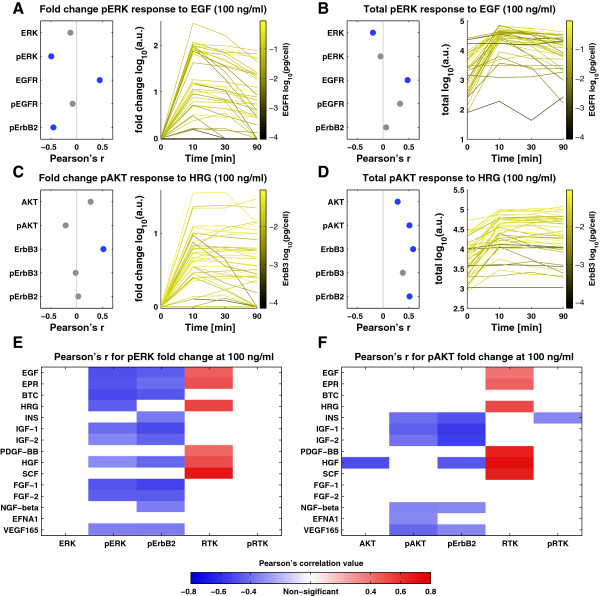
Expression levels of target receptors correlate with response. (A) The left panel depicts Pearson’s correlation of pERK fold-change in response to 100 ng/ml EGF and basal measures of the expression and phosphorylation levels of the downstream target, cognate RTK and pErbB2. Blue dots indicate correlations with P <0.05. The right panel shows the time course of pERK levels in response to EGF for individual cell lines with color denoting EGFR expression level (darker represents lower levels). (B-D) Plots as in (A) for absolute pERK levels in response to 100 ng/ml EGF (B); fold-change pAKT (C) and absolute pAKT levels (D) in response 100 ng/ml HRG. (E-F) Pearson’s correlation between pERK (E) and pAKT (F) fold-change response and the basal expression and phosphorylation levels of the downstream kinases, the level of pErbB2, and the basal and phosphorylation levels of the cognate receptor for all tested growth factors. Red denotes significant positive correlation and blue denotes significant negative correlation (P <0.05).
